TL;DR
- CASHCAT Market Overview: Multi‑year forecasts show a mix of modest gains, consolidation phases, and sharp upside potential driven by volatility and ecosystem growth.
- Yearly Trends: Predictions for CASHCAT from 2026–2032 highlight ranges that widen over time, reflecting stronger liquidity and evolving sentiment.
- CASHCAT Long‑Term Outlook: Experimental models point to significant upside in later years, though outcomes remain tied to market conditions and community momentum.
CASHCAT enters the market with a premise that leans entirely into its identity as a meme coin. It openly embraces “zero utility, as promised,” positioning itself as a playful tribute to a quirky piece of fintech history. Robinhood, before becoming a household name, carried the internal codename “Cash Cat,” and this token builds its entire narrative around that forgotten detail.
The project presents itself as the mascot returning to reclaim its name, turning corporate lore into blockchain fan fiction. This approach gives CASHCAT a distinct personality within the Robinhood Chain ecosystem, relying on nostalgia and community storytelling rather than technical breakthroughs.
Tokenomics Built for Simplicity and Fairness
The structure behind CASHCAT is intentionally straightforward. With a fixed supply of 1 billion tokens, a 0% buy and sell tax, and the full initial supply deposited into liquidity before the LP tokens were burned, the project aims to remove developer control and reinforce a community-first model. This setup mirrors the ethos of early meme coins that prioritized fairness and accessibility.
Its native deployment on the Robinhood Chain adds another layer of visibility, placing it directly inside a growing Layer-2 environment tied to one of the most recognizable brands in retail investing. The question now is whether a token built on narrative strength and ecosystem positioning can maintain momentum as the market evolves.
CASHCAT 2026 to 2032 Price Prediction
CASHCAT Price Outlook for 2026
Early predictions from CoinDataFlow outline a trading corridor for 2026 that stretches from $0.07068 at the lower end to $0.168429 at the upper boundary. When compared to today’s average value, this range points to a modest upside of roughly 2.55% if the asset reaches the higher target. The outlook leans toward a cautious but constructive stance.
A separate forecast from experts paints a more ambitious picture for the same year. According to this model, the asset could see a minimum value of $0.11963797, with an average level near $0.16445492, both sitting well above current market levels. The highest targets in this scenario are expected during periods of sharp price swings.
How CASHCAT Could Evolve Through 2027

Looking at the transition from 2026 into 2027, CoinCodex outlines a trading range that previously sat between $0.1054 and $0.1572, producing an average annualized level of $0.1179. That scenario translated into a projected ‑12.27% return, signaling a period where market sentiment leaned cautious, and liquidity pockets were still forming across newer ecosystems.
For 2027 specifically, the forecast shifts toward a more constructive outlook. Analysts highlight a minimum value of $0.10940607 and an average price near $0.15967945, both sitting above current levels. The mention of potential changes in circulating supply adds an important detail for investors tracking long‑term behavior.
Market Expectations for CASHCAT in 2028
Heading into 2028, analysts at DigitalCoinPrice outline a scenario where the asset begins the year near $0.0471 before climbing toward $0.16 as trading activity unfolds. That shift represents a sharp improvement compared with the previous cycle, signaling that sentiment could strengthen if market conditions remain supportive.
Another forecast expands on this outlook by presenting a more detailed range for the year. Analysts expect a minimum value of $0.10245393 and a maximum level near $0.1850656, suggesting that volatility could create meaningful opportunities for traders positioned during active market swings.
CASHCAT’s Potential Trajectory Heading Into 2029
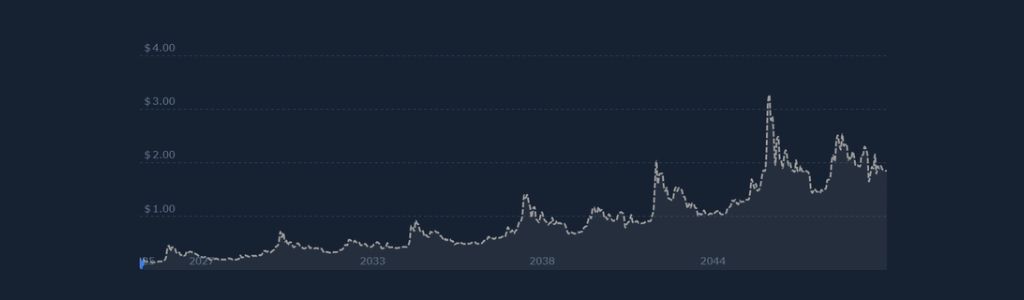
Projections for 2029 outline a trading corridor that stretches from $0.1532 to $0.2320, producing an average annualized level near $0.1726. Based on these figures, analysts estimate a potential 34.15% return, suggesting that the year could bring a more constructive phase compared with earlier cycles. This range reflects a scenario where liquidity improves.
Other models offer a more granular breakdown of the year’s performance. It begins with a starting value of $0.12457262, paired with a maximum of $0.19092943, a minimum of $0.099731928, and an average level around $0.14533068. By year‑end, the forecast places the exchange rate near $0.12733654, marking an 11.07% change over the period.
What 2030 Might Mean for CASHCAT’s Growth
Stepping into 2030, the forecast begins with a starting value near $0.14227286, paired with a maximum of $0.17965051, a minimum of $0.10199126, and an average level around $0.14082088. These figures outline a year shaped by steady movement rather than dramatic swings, suggesting that the asset may follow a more controlled trajectory as market conditions evolve.
A second model reinforces this same structure, presenting identical boundaries for the year and emphasizing the consistency across independent forecasts. The repetition of values, from the $0.14227286 starting point to the $0.17965051 peak, highlights a shared expectation that 2030 may unfold as a consolidation phase rather than a breakout year. The average is hovering near $0.14082088.
CASHCAT Forecast Trends Moving Into 2031
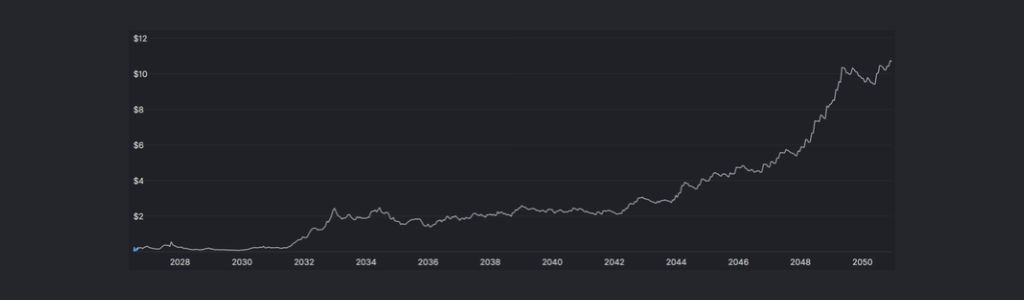
Forecast models for 2031 introduce a scenario with far more aggressive upside potential than previous years. Experimental simulations point to a possible 281.22% surge, placing the upper boundary near $0.626087 under ideal market conditions. The projected trading band between $0.626087 and $0.262336 reflects a year where volatility could become a defining feature.
Other analysts forecast offers a more measured breakdown of the year’s potential performance. It begins with a starting value of $0.11936918, paired with a maximum of $0.18361595, a minimum of $0.10637336, and an average level around $0.14499466. By the end of the year, the projected exchange rate sits near $0.13656049, marking a 13.10% change over the period.
Long-Term CASHCAT Projection for 2032
Entering 2032, technical models outline a scenario where the asset begins and ends the year near $0.86, suggesting a steady trajectory shaped by maturing market conditions. Alongside that projection, analysts highlight an additional upper movement toward $0.49, creating a secondary range that reflects how different forecasting approaches can diverge depending on underlying assumptions.
Another set of experimental simulations presents a far more aggressive outlook for the same year. Under the most optimistic conditions, the asset could climb 660.16%, reaching a potential peak near $1.24. In this scenario, price movement is expected to fluctuate between $1.24 and $0.384843, creating a wide band shaped by volatility and speculative interest.
Conclusion
The multi‑year outlook shows a token shaped by narrative strength, steady liquidity growth, and increasingly varied forecasts. Across 2026–2032, projections range from modest gains to sharp surges, highlighting how evolving market conditions, volatility, and ecosystem activity will continue to influence its long‑term trajectory.
If you’re thinking about investing in CASHCAT, keep in mind that expert forecasts vary widely, so we recommend that you conduct your own in-depth research before making any decisions.
The Price Predictions published in this article are based on estimates made by industry professionals; they are not investment recommendations, and it should be understood that these predictions may not occur as described.
The content of this article should only be taken as a guide, and you should always carry out your own analysis before making any investment.