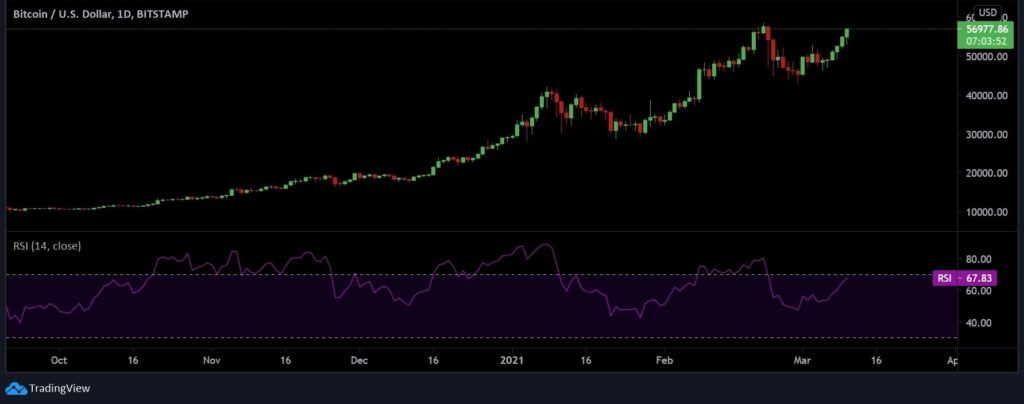
Bitcoin is on a roll. The world’s largest cryptocurrency is closing down on 6-straight days of green candles depicting a price rally on the chart. Its weekly gains have been a decent 12% and it was currently trading at $56,913 after a minor correction.
Despite the super bullish environment, here’s what the Bitcoin HODLers of the different cohort were up to:
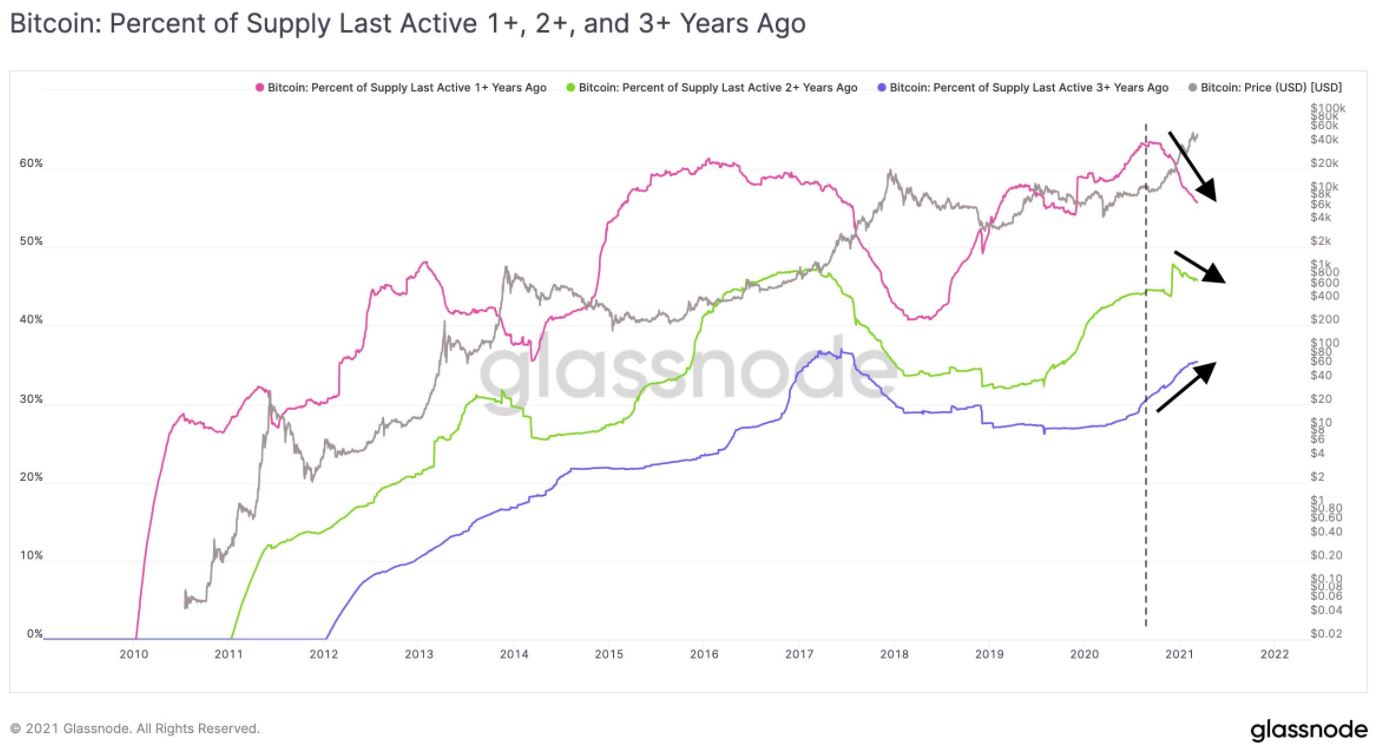
BTC HODLers of both 1+ and 2+ years were selling their coins while 3+ year HODLers were, in fact, holding their tokens. This was revealed by Rafael Schultze-Kraft, who happens to be the Co-founder and CTO of the blockchain intelligence platform, Glassnode in his tweet which said,
“3+ year hodlers aka “been in a bull market before and know how this works”: stacking sats”
If the exec’s commentary and the above chart are to be believed, the new investors are selling off their coins as soon as Bitcoin jumped close to its ATH. This was not the case with the older investors who had gone through the previous bull market and were much confident on the present one.
Also, it is important to note that, Bitcoin could very much be primed for more gains. Here’s why:
Strong Case Of Support
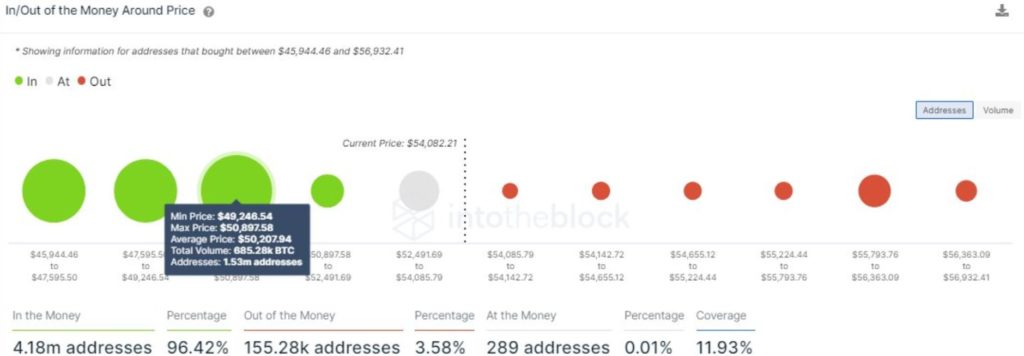
As Bitcoin surged above $50,000 after weeks of struggle, it crossed a major hurdle, beyond which, there’s very little resistance near its recently established peak. That is exactly what the latest charts by IntoTheBlock depicted.
According to the IOMAP metric, that there isn’t any significant resistance that could prevent BTC from climbing to the $57,000 level. Moreover, there’s strong support between levels $49,246 to $50,890. This is where there are a whopping 1.53 million addresses holding 685K BTC.
Hence, Bitcoin is now eyeing to breach this crucial level to reach new heights. Having said that, there is an indicator that is not completely sold on the fact yet.
Bitcoin Could Still Be In Consolidation Mode
This prospect is not all bad and, if true, it holds a lot of upside potential for the cryptocurrency. This was revealed by the latest CryptoQuant’s chart on Bitcoin net flows. There is no doubt that the outflow of coins from exchanges was still in motion. However, the flows are not aggressive as was seen during December 2020 – February 2021.
In fact, the figures were more balanced currently, meaning outflows and inflows remained in parity. So how far is the top? Upon closer inspection of the above chart, it was found that the net flows have been on the negative side.
This could suggest that a global top has not been reached yet and hence, there is a chance that Bitcoin could be potentially in a consolidation phase and an upswing could, in fact, be very much in the cards.
If you found this article interesting, here you can find more Bitcoin news

