Ethereum trades near $2,700 after a quarterly recovery close to 70% from lows around $2,400. The relevant question for derivatives traders, fund managers, and treasury teams is not the size of the move.
The relevant question is whether market structure allows the trend to persist through Q4. My thesis is direct: fundamentals support continuation, while technical structure and leveraged positioning impose strict conditions for validation.
The Supply Zone Between $2,722 and $2,822
The technical element dominating short-term reading is the supply zone between $2,722 and $2,822. The band contains more than 13.3 million ETH traded in prior cycles, a data point converting the area into resistance with significant historical volume.
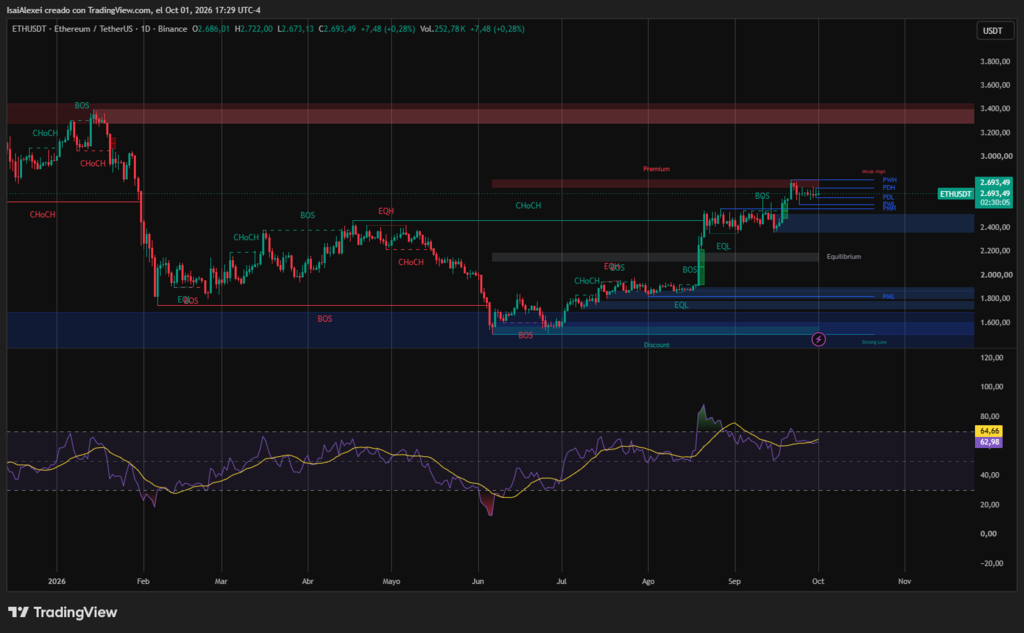
A daily close above $2,800 would enable a projection toward $3,000, a level with psychological load and concentrated sell orders. A failed breakout returns price toward $2,530–$2,570, where support sustaining the current bullish structure sits.
Price behavior in September is informative. Ethereum reached $2,805 and retraced without consolidating above the band. Each breakout attempt generated liquidations of long positions in relevant amounts, with one episode exceeding $96 million. The reading is that supply in the zone comes not only from passive orders but also from traders using the level to close exposure.
Moving Averages and Momentum
The moving average structure maintains a bullish alignment. Ethereum trades above the 20-day (2,609), 50-day (2,435), and 200-day (2,110) averages. Recovery of the 100-week EMA reinforces the trend reading. Momentum indicators introduce nuance.
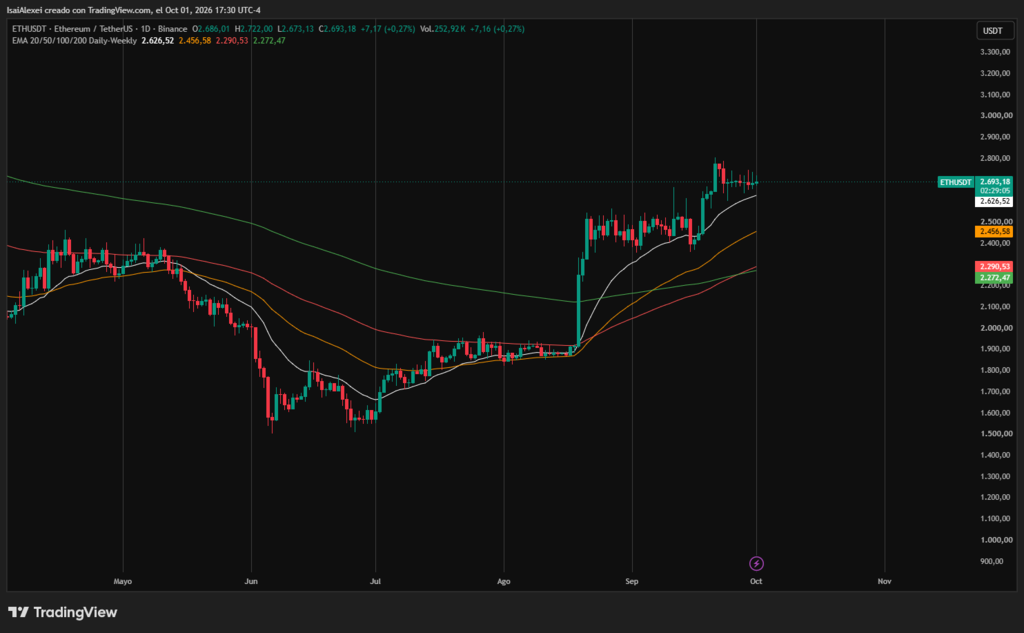
The MACD histogram compressed to values near zero, and the stochastic oscillator turns lower from overbought territory. The technical interpretation corresponds to short-term exhaustion, not trend reversal.
Positioning: Retail and Institutional Divergence
Positioning data show a divergence deserving attention. 73.6% of retail accounts hold long positions, while larger futures traders register 61.4% long exposure. The difference matters because the retail segment concentrates liquidation risk under adverse moves. The taker buy/sell ratio already tilted toward sellers, a signal that aggressive buying pressure lost intensity.
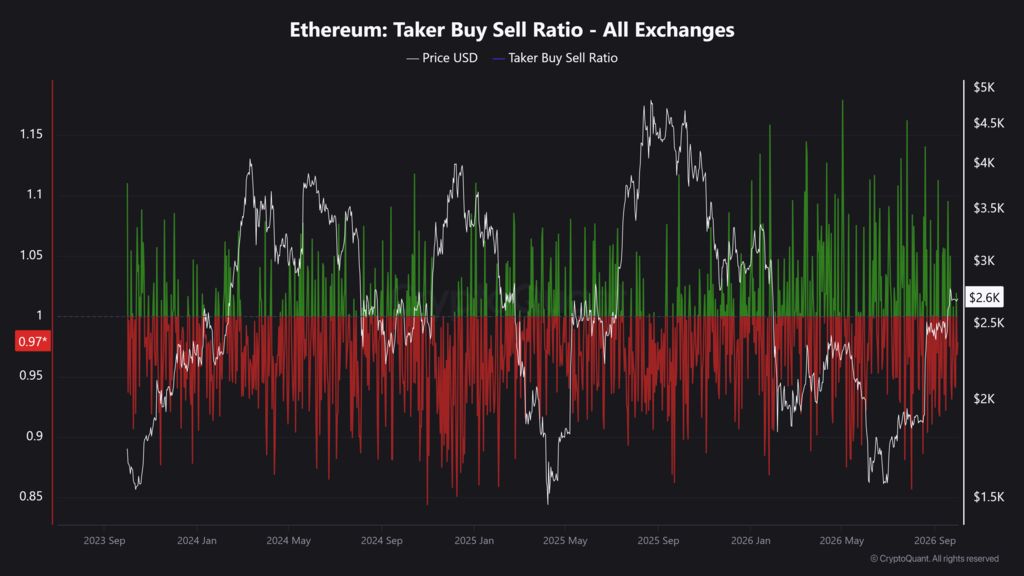
A positioning structure with high long bias does not invalidate a bullish trend. It establishes a condition: breaking an intermediate support activates forced selling and accelerates downside movement. The $2,640–$2,660 level functions as first reference. Loss of the floor opens the path toward $2,530–$2,570.
Glamsterdam: The Network Catalyst of the Quarter
The fundamental catalyst with greatest weight on the calendar is the Glamsterdam upgrade. The Sepolia testnet fork is scheduled for October 6, with mainnet deployment planned for Q4. Technical changes include parallel transaction processing, block propagation time reduction from 9 to 2 seconds, higher gas limit, and enshrined proposer-builder separation (ePBS).
A successful Sepolia deployment reduces uncertainty about roadmap execution and enables narrative for institutional allocations. A delay or technical failure produces the opposite effect and affects perception of execution risk.
Institutional Flows and Exchange-Traded Vehicles
Spot Ethereum ETFs recovered traction. Records show inflows near $700 million in one week and cumulative flows close to $14 billion. BlackRock’s ETHA concentrated $326 million in the same period.
My reading of flows is cautious. Inflows into exchange-traded vehicles respond to allocation decisions with quarterly horizon, not short-term operations. Flows sustain structural demand in the spot market but do not eliminate fragility in the derivatives market.
The combination of positive flows with elevated leveraged positioning produces a market with firmer base and greater sensitivity to liquidity shocks.
Corporate Treasuries and Staking
Accumulation from corporate treasuries represents another demand source. BitMine Immersion Technologies reports holdings of 5.98 million ETH, with more than 85% in staking. The staking proportion reduces available circulating supply and lowers potential selling pressure.
Risk associated with concentration in few treasuries is second-order, but present. An entity with dominant position can alter supply dynamics if accumulation policy changes. Risk evaluation must incorporate scenarios of reduced purchases, not only increased buying.
ETH/BTC Ratio and Seasonality
Seasonality in Q4 does not favor Ethereum. Since 2021, ETH has not outperformed Bitcoin in Q4. The ETH/BTC ratio tests the 0.03 reference. A confirmed break above the level would indicate capital rotation toward Ethereum. Absence of a break suggests capital remains in Bitcoin and Ethereum operates as market beta.
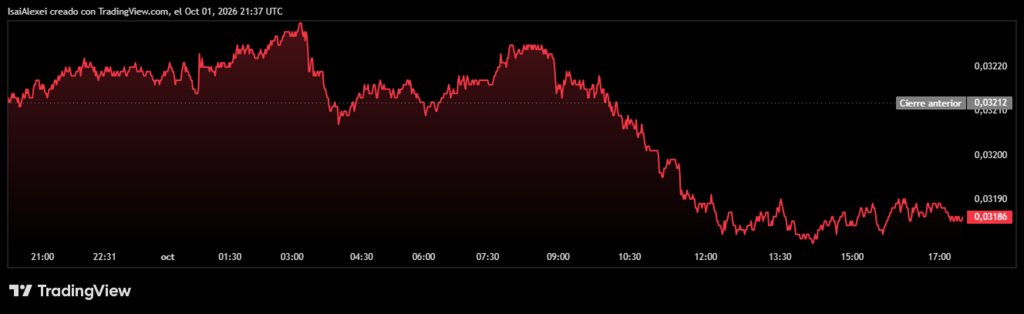
My interpretation is that the ratio functions as an allocation filter. Managers seeking exposure to smart contract infrastructure observe the relationship before increasing positions. Without a relative strength signal, incremental demand arrives through passive flows and not through tactical rotation.
Forecasts and Evaluation Criteria
Arthur Hayes proposes $10,000 for end-2026. Tom Lee manages targets of $6,000 to $10,000 with twelve-month horizon. Standard Chartered publishes $7,500 for end-2026. Prediction markets assign probability near 70% to a visit of $3,000.
My position on forecasts is that utility is limited for risk management. Twelve-month targets do not inform probability of a breakout in the current quarter. The relevant exercise consists of defining invalidation conditions. For the bullish hypothesis, invalidation sits at a weekly close below $2,530. For the range hypothesis, invalidation is a daily close above $2,800.

Ethereum arrives at Q4 with fundamentals supporting continuity: a network upgrade with imminent deployment, positive institutional flows, and sustained accumulation from corporate treasuries. Technical structure does not confirm the breakout. Price remains within a consolidation range, and leveraged positioning raises the cost of an error.
The operational decision I suggest consists of treating $2,800 and $2,530 as mutual invalidation references, and monitoring three concrete indicators: the Sepolia fork result on October 6, the evolution of the ETH/BTC ratio against 0.03, and the behavior of the taker buy/sell ratio in futures markets. Trend continuity depends on confirmation of all three, not on the narrative surrounding the levels.