
There are many metrics that gauges the performance of a blockchain project. Chief amongst this is the community, and understandably so.
Ethereum Developers Building
Developers are core and so are enthusiasts who cheer on creators and developers often hard work. Building and adding features to a product that’s expected to grow over time is an arduous task.
Not many manage to pass by this hurdle. However, for the likes of Ethereum, a project which extended Bitcoin’s functionalities, performance is gauged by use and that use is measured by gas. Gas is a token that powers Ethereum transactions and is used to pay fees.
As it is, Ethereum is now more active than Bitcoin judging from the amount of transactions fees paid over time.
Gas Fees reveals Ethereum demand
On June 15, 2020, the amount of gas paid soared to an all-time high, reaching over 61 billion according to data from CoinMetrics. Most of this can be attributed to the rise of stablecoins and the rise of open finance applications.
Stablecoins like Tether US (USDT) are the most active in Ethereum so much that the market cap of USDT exceeds that of XRP, the native currency of the XRPL.
Meanwhile, DeFi dApps are getting traction and sooner or later, the total value of locked Ethereum (ETH) may float above the $1 billion highlighting its significance.
The spike in gas transactions mean Ethereum is attractive to different cadre of users who demand for block space thereby pumping the amount of “gas” required for miners to verify and seal blocks in the platform.
ETH/USD Price Analysis
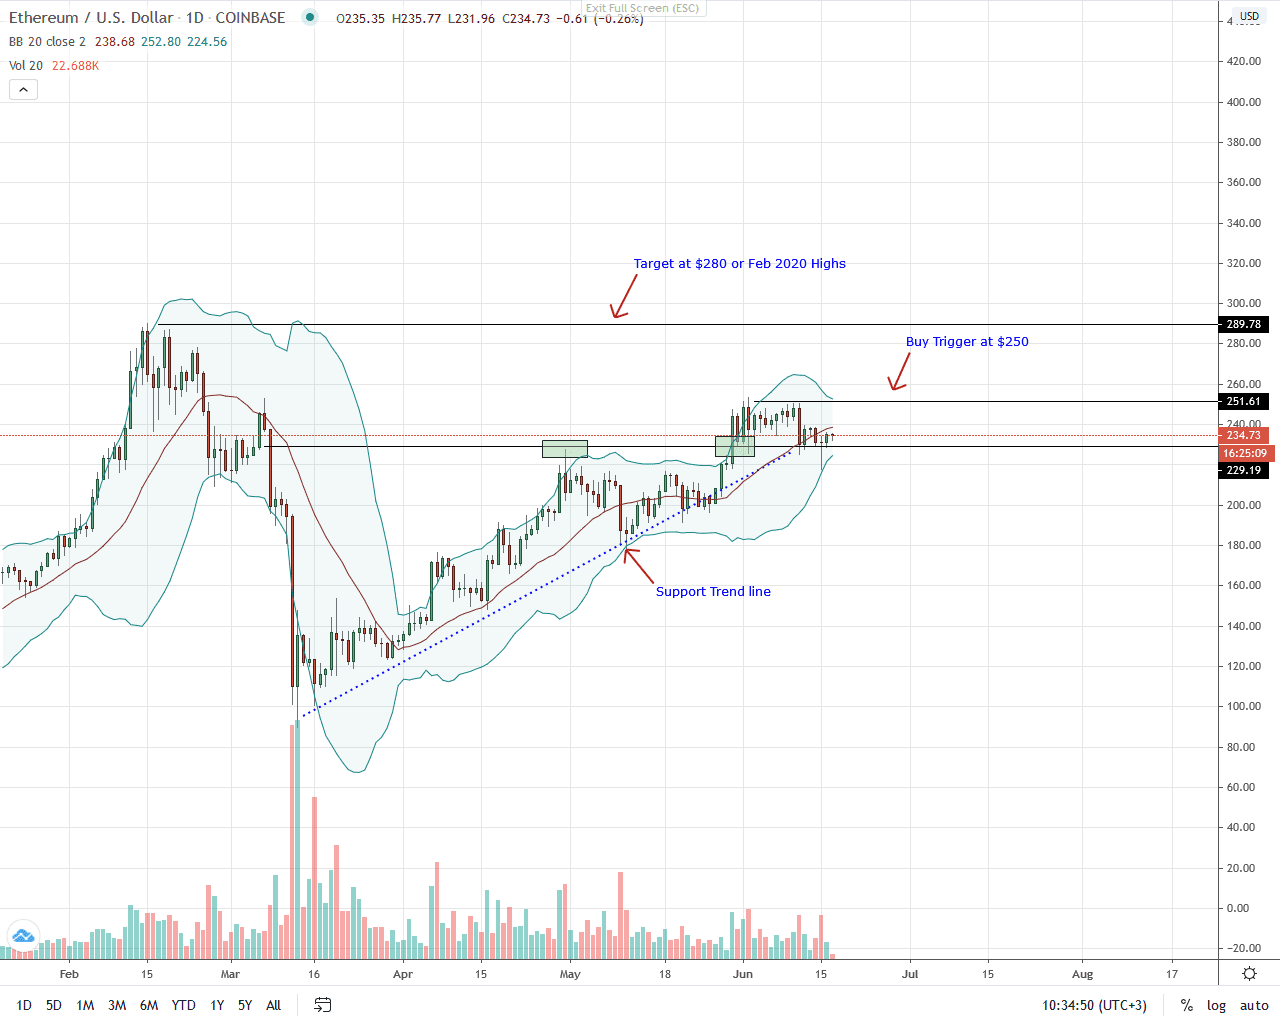
At the time of writing, ETH price is down three percent in the last week of trading and stable in the past 24 hours. It is also down against the Bitcoin in the same period. Still, the trend remains bullish and every low is technically a buying opportunity for aggressive traders.
From the daily chart, $230 remains as the immediate support line and the failure of sellers to follow through June 11, 2020 price collapse means there is a chance for buyers to buy the lows with modest targets at June 2020 highs.
However, for risk-averse traders, it is imperative that prices snap back to the main trend by racing past $250 at the back of high trading volumes. That will reverse losses of June 11, 2020, and the double bar bear reversal pattern of June 10-11, 2020.
As mentioned in previous ETH/USD price analysis, a clear break above 250$ could spur bulls aiming at Feb 2020 highs of 280$.
On the reverse side, steep losses below 230$ and the three-month support trend line confirm losses of June 11, 2020. In that case, ETH may fall to 200$.
Disclaimer: This is not investment advice. Opinions expressed here are those of the author and not the view of the publication.
If you found this article interesting, here you can find more Ethereum News