
The Ethereum (ETH) price is flat when writing, moving inside a narrow range and in a bearish formation, as evident in the daily chart. Even though buyers are optimistic, losses below $1,600, confirming losses of August 17, could heap more pressure on the second-world largest crypto by market cap.
As it is, traders can look for selling opportunities, considering price action is inside the bearish engulfing bar of August 17. At the same time, trading volumes have been relatively thin as buyers fail to break above $1,750, confirming buyers of August 29.
The sell-off and general weakness are amid supportive fundamentals and the continuous burning of ETH with every transaction or smart contract executed.
On-Chain Metrics Are Not Good
Overall, traders are cautious, and their stance is justified when looking at price action. To quantify, the coin is down roughly 20% from the July 2023 peak when it rose to around $2,030.
At spot rates, ETH is teetering close to June 2023 lows. If ETH bulls lose this spot, the coin will likely slide to $1,400 in a bear trend continuation formation.
Analysts are also concerned, pointing to relatively low demand levels from on-chain metrics. To illustrate, the number of active wallets fell roughly 4% in August.
At the same time, addresses with $1,000 or less of Ethereum stands at a 6-month low. While this happens, Gas fees remain higher, steadying around the $4 mark, the highest across the smart contracts scene.
Ethereum (ETH) Price Analysis
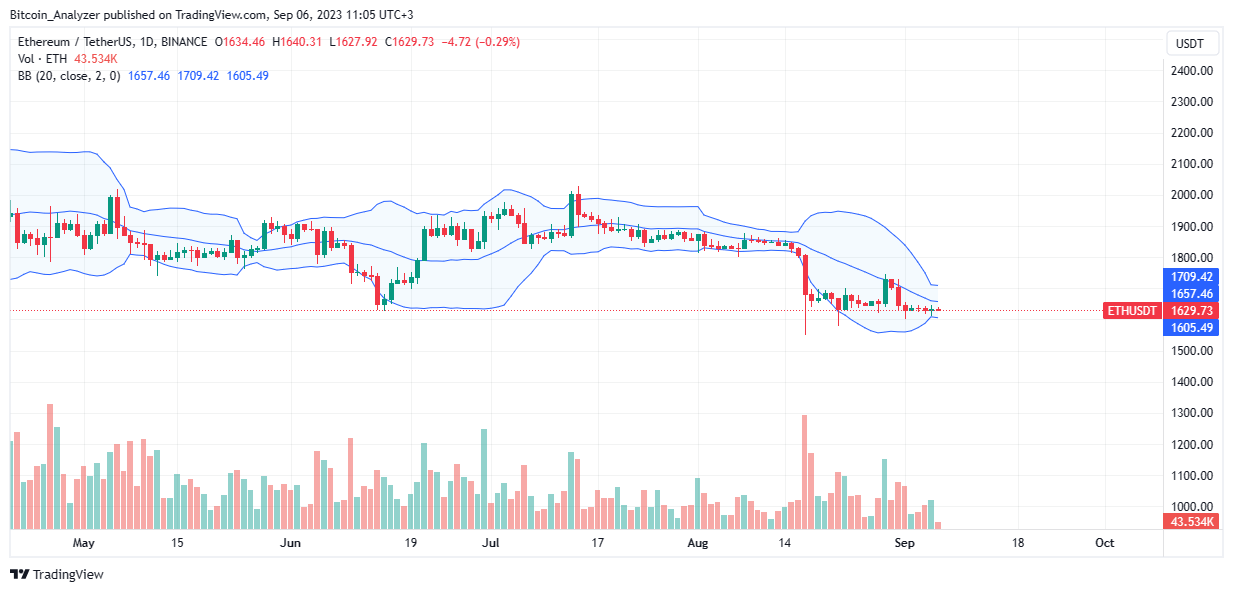
Ethereum is at June 2023 lows at spot rates, a critical support level. Beyond this, ETH prices are in a BB squeeze as volatility tapers and volumes shrink.
From the daily chart, the path of least resistance remains southwards. Immediate resistance is $1,750, printed on August 29. Until there is a reversal pumping the coin above this line, sellers have the lead, aligning with the August 17 bear candlestick.
Losses below $1,600 may trigger further sell-offs, opening opportunities for sellers to ride toward $1,400 in the medium term.
If the push below $1,600, or last week’s low, is with rising volumes, the first target will be the August 17 low at $1,550 and later $1,400.
Technical charts courtesy of Trading View.
Disclaimer: The opinions expressed do not constitute investment advice. If you wish to make a purchase or investment we recommend that you always conduct your research.
If you found this article interesting, here you can find more Ethereum news.