
TL;DR:
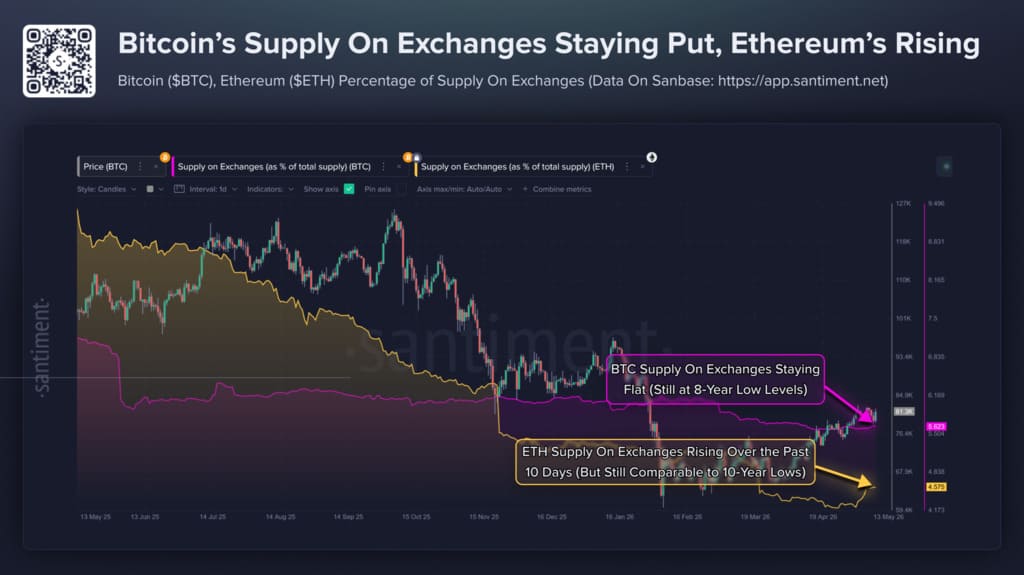
- Bitcoin’s supply on exchanges dropped to 5.6%, its lowest level since 2018, while net flows show a balance between deposits and withdrawals.
- Ethereum raised its exchange supply from 4.2% to 4.6% in ten days, driven by the inflow of approximately 240,000 ETH.
- Both assets are near historical lows on exchanges, but diverge in direction: BTC stable, ETH on the rise.
Bitcoin hit its lowest exchange supply level since 2018, fixed at 5.6% of total supply, according to data from Santiment. Far from reflecting inactivity, that stable percentage is the result of two opposing flows that cancel each other out: deposits and withdrawals operating in parallel at equivalent rates.
BTC’s current netflow registers -967.7 BTC, with a predominance of net outflows, although between May 11 and 14, daily inflows of between 2,500 and 4,000 BTC accumulated without managing to move the indicator.
Flows Explain the Divergence
CryptoQuant data for the period from April 15 to May 16, 2026 illustrates the reason and mechanism behind this stability. In Bitcoin’s case, the pressure exerted by withdrawals absorbs incoming deposits as they occur, keeping the percentage unchanged. That active equilibrium held even through the price shock tied to the PPI print and the subsequent recovery above $82,000, suggesting there is a base of holders that does not yield to short-term volatility.
Ethereum shows a different dynamic. On May 10, an inflow of approximately 240,000 ETH was recorded, the highest entry bar on the chart. That single event raised exchange supply from 4.2% to 4.6% in just ten days. The negative flows recorded between May 12 and 15, with a current netflow of -14,200 ETH, have not been sufficient to reverse what a single session generated.

Ethereum Shows a Distribution Pattern Bitcoin Cannot Replicate
Santiment notes that Ethereum’s exchange supply remains near its all-time low since the asset began trading publicly in 2015, but the direction has changed. Whether the May 10 spike corresponded to holders who accumulated ETH below $2,000 during February and March 2026, or to another type of movement, the result is the same: selling pressure grew and has not yet been absorbed.
A reversal of ETH supply below 4.2%, sustained by consistent daily net outflows, would indicate that the spike was absorbed and that holders are resuming prior behavior. If instead ETH supply holds above 4.5% with new inflow peaks comparable to that of May 10, the divergence from Bitcoin would be structural rather than transitory.