The CoinMarketCap Altcoin Season Index closed at 34 points on September 2. The threshold of 75 defines the condition for a full altcoin season—requiring at least 75% of the top 100 cryptocurrencies (excluding stablecoins and wrapped tokens) to outperform Bitcoin over the 90-day window. A reading of 34 implies that barely one-third of major altcoins have generated positive relative returns against BTC in the quarter.
Bitcoin dominance stood at 59.57% on the same date. Historically, levels above 58% have acted as ceilings for capital accumulation in the leading crypto. The outflow of capital from Bitcoin toward the broader altcoin ecosystem has not materialized in aggregate flows, despite isolated rotation attempts observed in certain weeks of August.
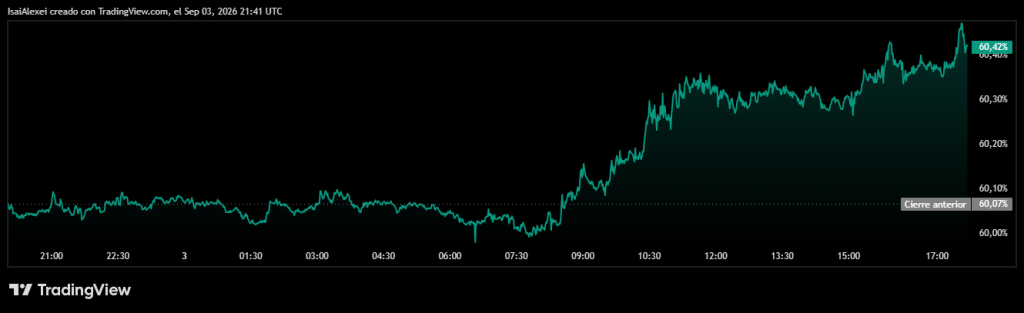
This macro framework does not invalidate the existence of specific catalysts for individual projects. September presents a structural dissociation: the aggregate market metric signals contraction in risk appetite for alternative assets, while certain protocols display network fundamentals, monetary policy adjustments, or regulatory events of bounded impact. Analyzing these four assets—Solana, Hyperliquid, XRP, and Kaspa—requires separating the noise of the general trend from the valuation factors inherent to each network.
Solana: Moving Average Convergence and the SIMD‑553 Burn Mechanism
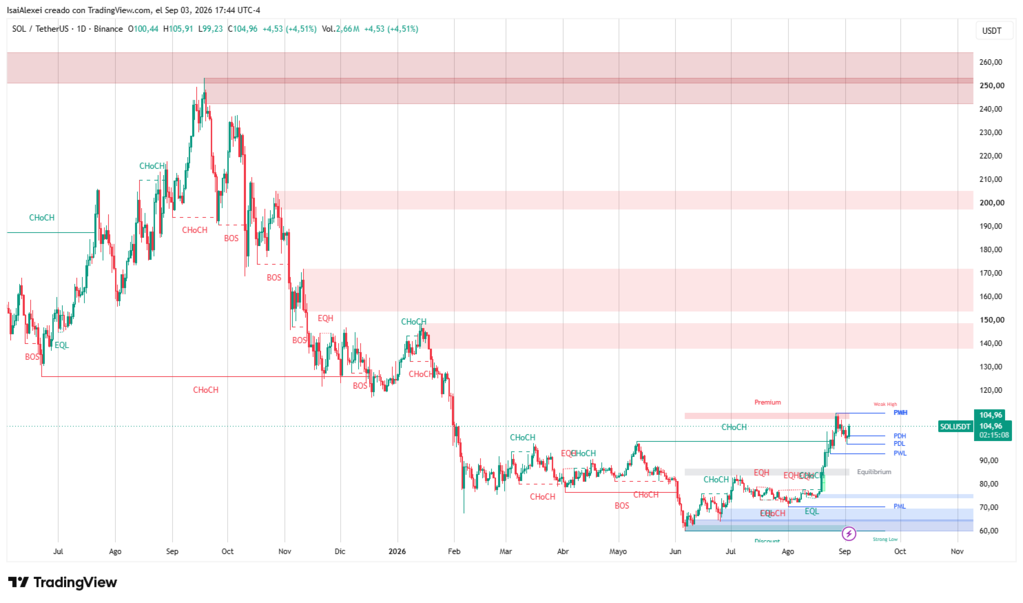
Solana (SOL) trades near the $100 zone during the September 3 session. The asset failed to hold the ascending channel after reaching $109 in prior sessions, activating short‑term selling pressure. Wave structure analysis places the current move as a fourth‑wave correction, with relevant support levels at $94.83 and $90.46, corresponding to the 38.2% and 50% Fibonacci retracements from the prior leg. The 50‑day simple moving average stands at $80.59, while the 100‑day SMA registers $80.67. The eight‑cent differential suggests a potential bullish convergence in the coming days, though confirmation of the crossover remains pending.
Solana’s microeconomic catalyst resides in the implementation of SIMD‑553, approved and merged on July 20. This proposal introduces a burn fee for requested compute units, raising the daily SOL destruction rate from a range of 600–800 units to a range of 7,500–9,000 units. This adjustment reduces the net effective issuance rate without altering the annual inflation policy. On this point, the SIMD‑550 proposal—which aimed to accelerate inflation reduction from 15% to 1.5% over three years—did not obtain the necessary on‑chain votes, so the current emission schedule remains on its original calendar.
Accumulated flows into the spot SOL ETF exceed $1.34 billion, with monthly growth of $193 million in August—the highest figure since November 2025. The total value locked in Solana’s DeFi ecosystem stands at $5.84 billion. These institutional investment flows and increased activity in the smart contract layer constitute structural demand for the asset. The constraint lies in SOL’s beta coefficient relative to Bitcoin, which triples the volatility of the leading asset. During risk‑contraction sessions, this relationship amplifies losses, a factor that invalidates any thesis of relative safe‑haven status within the alternative segment.
Hyperliquid: OI Growth and the Uncertainty of the September Unlock
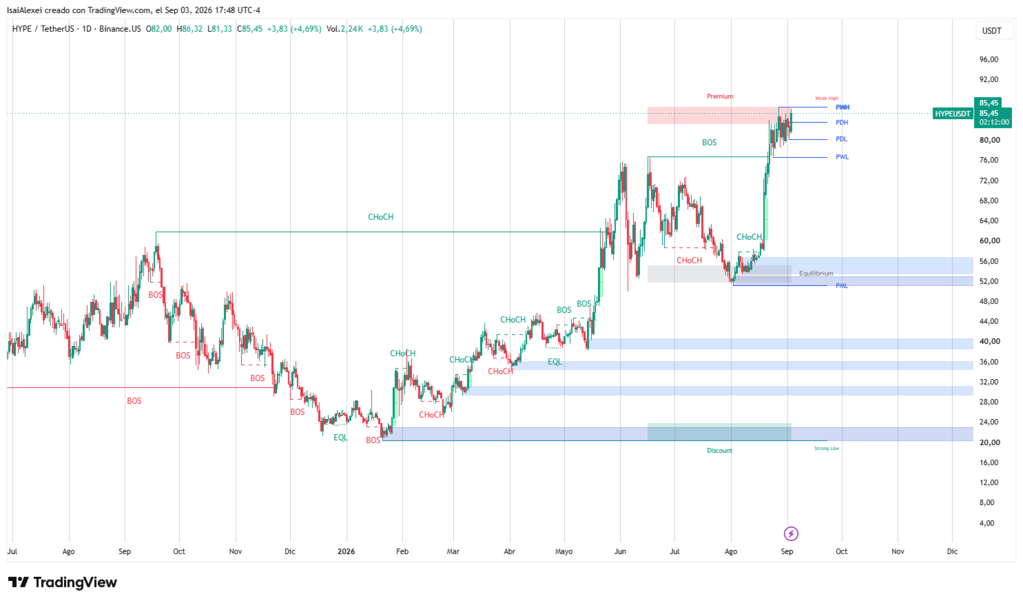
Hyperliquid (HYPE) marked an all‑time high of $83.27 on August 24 and holds a price near $77.50 in early September. The asset trades above all its major daily moving averages. The Average Directional Index (ADX) stands at 50.26, a level confirming the strength of the current directional trend. Immediate support lies at $78.98, while the 20‑day exponential moving average is at $75.08.
Open interest in Hyperliquid’s derivatives market has expanded from approximately $1.5 billion at end‑2025 to about $3.45 billion in September. This OI expansion acts as a volatility multiplier: it amplifies directional moves but also increases the probability of cascade liquidations if price retraces into support zones with high leverage concentration.
Total fee revenues for the first half of 2026 reached $419.3 million, representing 31% year‑over‑year growth, with a 90% increase in daily active users. However, core protocol revenues—those flowing to the platform treasury—declined from $317.5 million in H1 2025 to $305.3 million in H1 2026. Total revenues have consecutively declined from the peak of $357 million in Q3 2025, reaching $202 million in Q2 2026. This contraction is attributed to the restructuring of fee allocation following the implementation of proposal HIP‑3.
The September 6 unlock event introduces a potential supply of 9.92 million HYPE tokens, valued at approximately $797 million at the August 27 price. Tokenomist classifies the event as “committed,” though the exact number of tokens that will actually enter the market depends on the behavior of core contributors and early holders. Hyperliquid’s unlock history indicates that actually claimed amounts have repeatedly fallen short of projections.
XRP: The Seasonal Rule and the CLARITY Act Voting Threshold
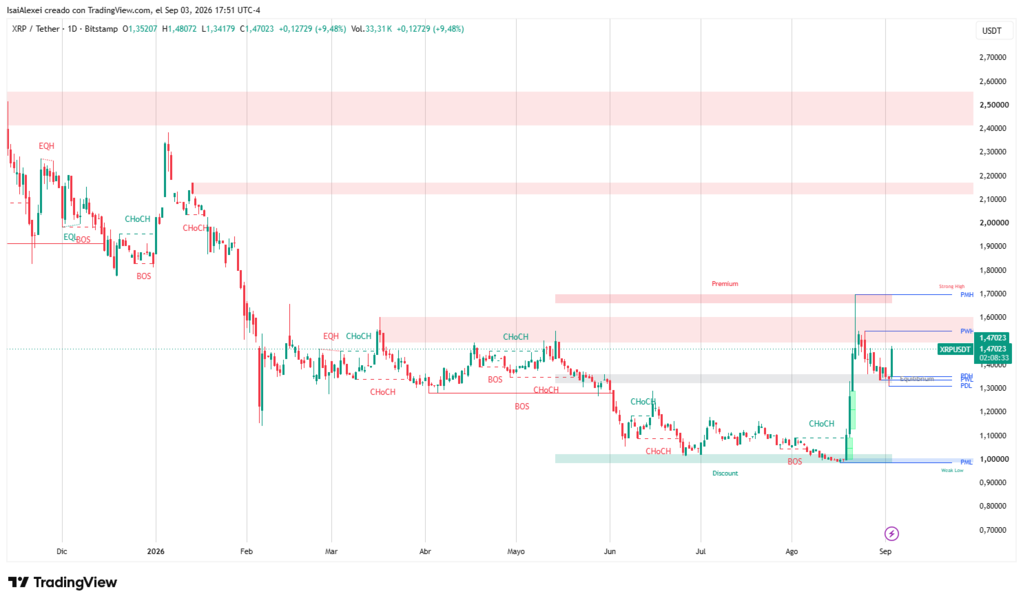
XRP trades at $1.35 at the start of September, with a cumulative return of 30% during August. The historical monthly return series shows an average of +17.0% in September, followed by a contraction of -19.6% in October and an expansion of +30.5% in November. The XRP/BTC ratio stands at 0.00001754, a level representing a 48% discount from the January 2025 high of 0.00003415.
The regulatory catalyst concentrates on the CLARITY Act, whose cloture vote is scheduled for September 15. The vote requires 60 ballots to advance H.R. 3633. Section 105 of the bill establishes that SEC jurisdiction over digital assets previously classified as non‑securities by final judicial rulings becomes automatically limited. The implied probability on Polymarket for the bill becoming law before end‑2026 sits below 20%.
Flows into the spot XRP ETF have shown eleven consecutive days of positive entries, accumulating $170 million in the recent period. Cumulative transaction volume on XRP’s ledger exceeds 3 billion operations. The monthly release mechanism of 1 billion tokens from Ripple’s custody account, of which approximately 700 million were re‑locked in September, moderates the net impact on circulating supply.
The technical reading places the target range in case of regulatory advancement between $1.68 and $1.86. Failure of the September 15 vote would maintain the current regulatory status, meaning legal risk remains in force for the asset throughout the remainder of the fiscal year.
Kaspa: The 96% Circulation Rate and the Weekly Downward Channel
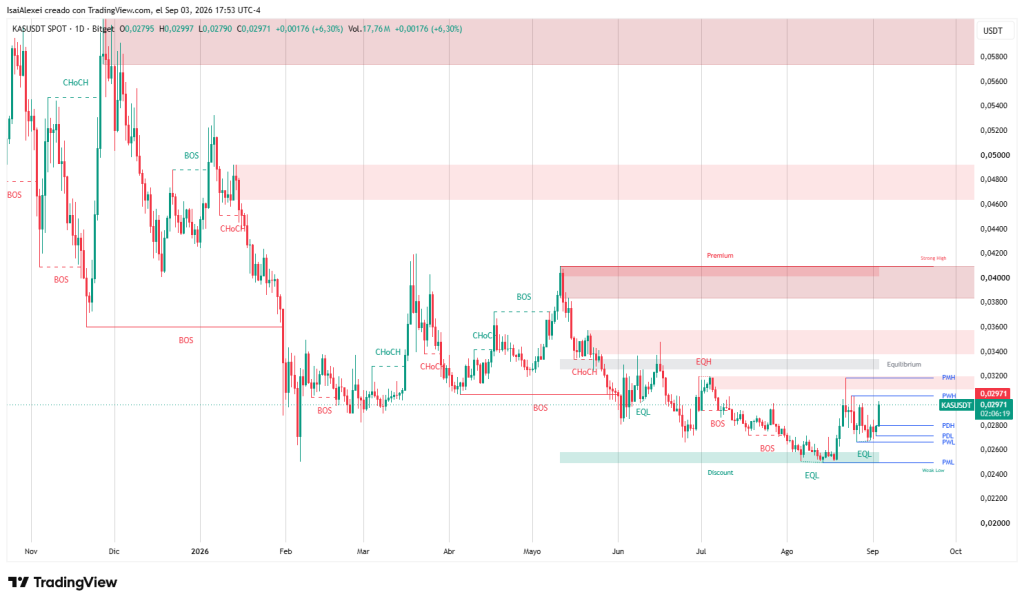
Kaspa (KAS) trades at $0.02735, with a market capitalization of $757 million. The price represents an 87% retracement from the all‑time high of $0.20741 reached in August 2024. The weekly chart shows a descending channel in force, with the channel’s upper boundary at $0.03962. Rejection at that level during the recent recovery attempt confirms the medium‑term bearish structure.
Kaspa’s differentiating feature lies in its supply structure. Current circulation stands at 27.659 billion tokens out of a maximum supply of 28.704 billion, implying that 96% of total KAS is already in circulation. This percentage far exceeds that of most proof‑of‑work assets, whose emission schedules extend over several years.
The fair‑launch model with no pre‑sale or venture capital allocation eliminates the category of institutional unlocks. The monthly decreasing emission policy—termed colored emission—progressively reduces structural supply pressure.
The Toccata hard fork introduced programmability capabilities to the network, enabling smart contract and application development on the BlockDAG architecture with the GHOSTDAG protocol. The technical differentiation positions Kaspa as a layer‑1 alternative with theoretical throughput superior to linear chains.
However, the weekly bearish channel structure has not been invalidated. Immediate support sits at $0.02517, with a secondary level at $0.01809. Any bullish thesis for KAS requires a break above the channel’s upper boundary and confirmation of a new accumulation range above $0.040.
Macro Risk Factors and the Ceiling of Dominance
The September 15–16 FOMC meeting constitutes the primary monetary policy determinant for the month. Federal Reserve Governor Michelle Bowman stated on Tuesday that a rate hike must be executed if inflation does not show sufficient cooling. Implied‑probability tools assign between 48% and 66% probability of a 25‑basis‑point adjustment, depending on the September 11 CPI reading. A core inflation figure above the 3.2% projection would reinforce the Committee’s restrictive stance.
Geopolitical risk added an uncertainty premium during the first days of September. U.S. strikes on Iranian military targets and the ballistic missile response lifted Brent crude above $95 per barrel. The 10‑year Treasury yield reached 4.81%, levels not seen since Q1 2026. These moves in traditional assets affect the opportunity cost of holding positions in high‑volatility digital assets.
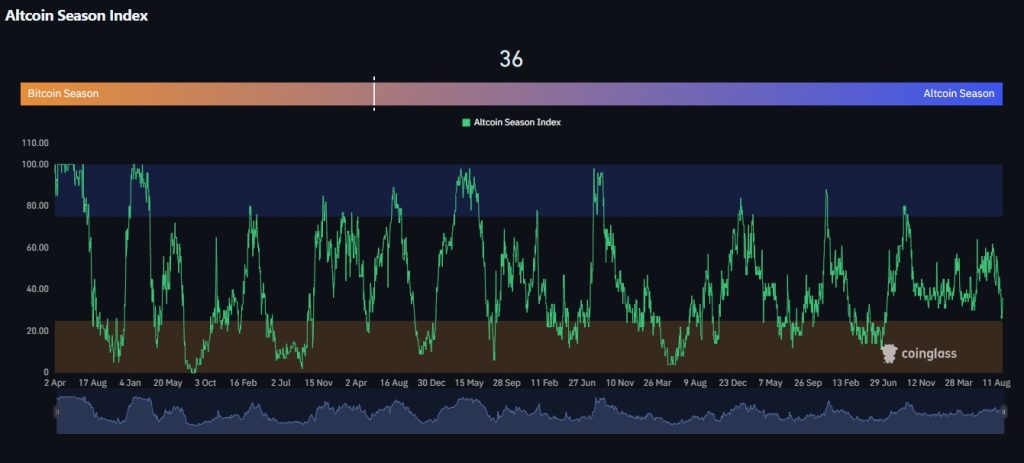
The altcoin season index at 36 and Bitcoin dominance at 59.57% constitute a structural cap on any sector rotation. Bitcoin acts as the ecosystem’s liquidity anchor: during risk‑aversion episodes, capital flows migrate from high‑beta assets to the largest‑cap asset with lower relative volatility. This dynamic implies that even projects with the strongest microeconomic catalysts face a ceiling determined by Bitcoin’s ability to sustain or expand its current price range.
September 2026 presents a dissociation between market aggregates and project‑specific fundamentals. Solana (burn‑rate adjustments and ETF flows), Hyperliquid (OI growth and scheduled unlock), XRP (regulatory event and historical seasonality), and Kaspa (nearly fully circulated supply and contract‑layer development) concentrate the most identifiable catalysts within the alternative segment.