Ripple deals with money. For a new technology willing to disrupt and introduce progressive developments, changing the old order, resistance from the status quo is high. And it has shown for Brad Garlinghouse, the CEO of the for-profit Ripple.
Their mission is to change remittance by integrating the blockchain and offering new solutions immensely transforming the conservative financial sector. Ripple has the RippleNet. It is a suite comprising three solutions.
However, while their messaging platform is wildly popular among partner banks, the On-Demand Liquidity (ODL), a solution that uses XRP, is struggling. Brad, confident of market recovery in 2019, said banks and financial institutions would adopt the technology. Progress has, judging from the number of partners in the last 18 months and regulatory headwinds, been slow, to say the least.
Admitting that he might have jumped the rope, Brad is now complaining of the “absence of a level playing field” from a regulatory standpoint. The executive, in a recent interview, said Ripple was “fighting with one hand tied” while Bitcoin has the “hall pass.”
Even though Ripple has a decentralization strategy, diffusing the number of coins and nodes under their control, there are complaints that XRP is being manipulated and is a security.
Peter Brandt, a chartist, said the US Securities Exchange Commission (SEC) should have classified XRP as a security only if “they understood cryptos” suggesting that Ripple was highly likely manipulating market prices.
Ripple Price Analysis
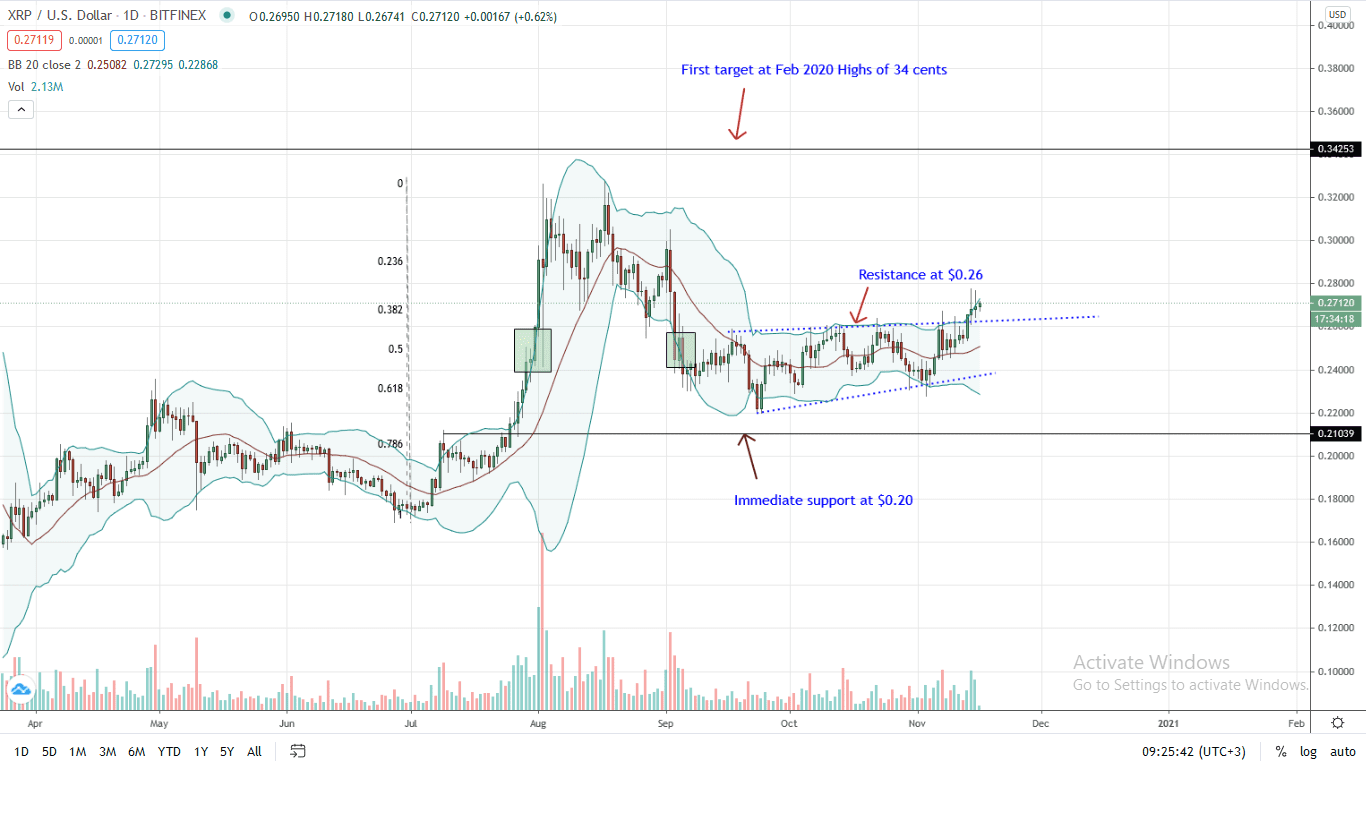
The Ripple price is trading at a 2-month high after last week’s break and close above a primary resistance trend line visible in the daily chart.
At the time of writing, the Ripple price is up six percent against the USD, outperforming ETH and at break-even with BTC in the last week of trading.
Candlesticks’ arrangement in the daily chart suggests weakness. Notably, the last two bars are with long upper wicks. This hints at possible sell pressure in lower time frames. The short lower wicks could mean weak bulls and buy pressure.
The Ripple price is beginning to band along with the upper Bollinger Band (BB). As a volatility and momentum indicator, it is sensitive to price movements. Higher highs and banding along the upper BB may spark more demand, pushing prices towards Aug 2020 highs as the positively inclining 20-day moving average (middle BB) acts as flexible support.
Traders can wait for the confirmation of the buy breakout. A possible marker will be the expansion of trading volumes and rejection of lower prices below $0.25.
A close above $0.28 this week may usher in buyers in a wave that may drive the Ripple price above Aug 2020 highs of $0.32.
Chart courtesy of Trading View
Disclaimer: Views and opinions expressed are those of the author. This is not investment advice. Do your research.
If you found this article interesting, here you can find more Ripple news