Amid the across-the-board slump of digital assets, Ripple hasn’t been spared. The Ripple price, as Bitcoin tread higher, is weak and currently trading below important liquidation levels.
Still, supporters remain optimistic. Following the failure of buyers to drive prices above $0.25 and even $0.30, there are solid fundamentals around adoption.
Often, and regardless of what a cryptocurrency project has up its sleeves, the primary determinant for success is utility. That means, the extent of which users utilize the platform—and the native currency, in their day-to-day operations.
MoneyGram’s Turnaround
Although most RippleNet financial institutions use xCurrent, not the On-Demand Liquidity solution that use XRP for cheap and instantaneous remittance, news of Ripple’s continuous support of MoneyGram—a remittance firm rescued from the brink of bankruptcy, is a net positive.
For their support, MoneyGram use the ODL in their operations.
From their Q3 2020 report, the remittance company revealed that Ripple doled out $9.3 million as MoneyGram went on to realize profits of $8.9 million after spending $0.4 million on expenses. In Q1 and Q2 2020, Ripple spent $15.1 million and 11.3 million, respectively, on-top of the $50 million it used in acquisition.
Ripple Labs Oracle Patent
Meanwhile, Ripple Labs has received a patent from the United States Patent and Trademark Office (PTO) for an oracle service.
The patent, initially filed in 2018 and authored by the former CTO and the founder of Coil, Stefan Thomas, details a way of first, enabling smart contracting in Ripple—an initiative under Project Codius, before linking smart contracts with verified real-world data therefore drastically expanding the number of Ripple use cases.
Ripple Price Analysis
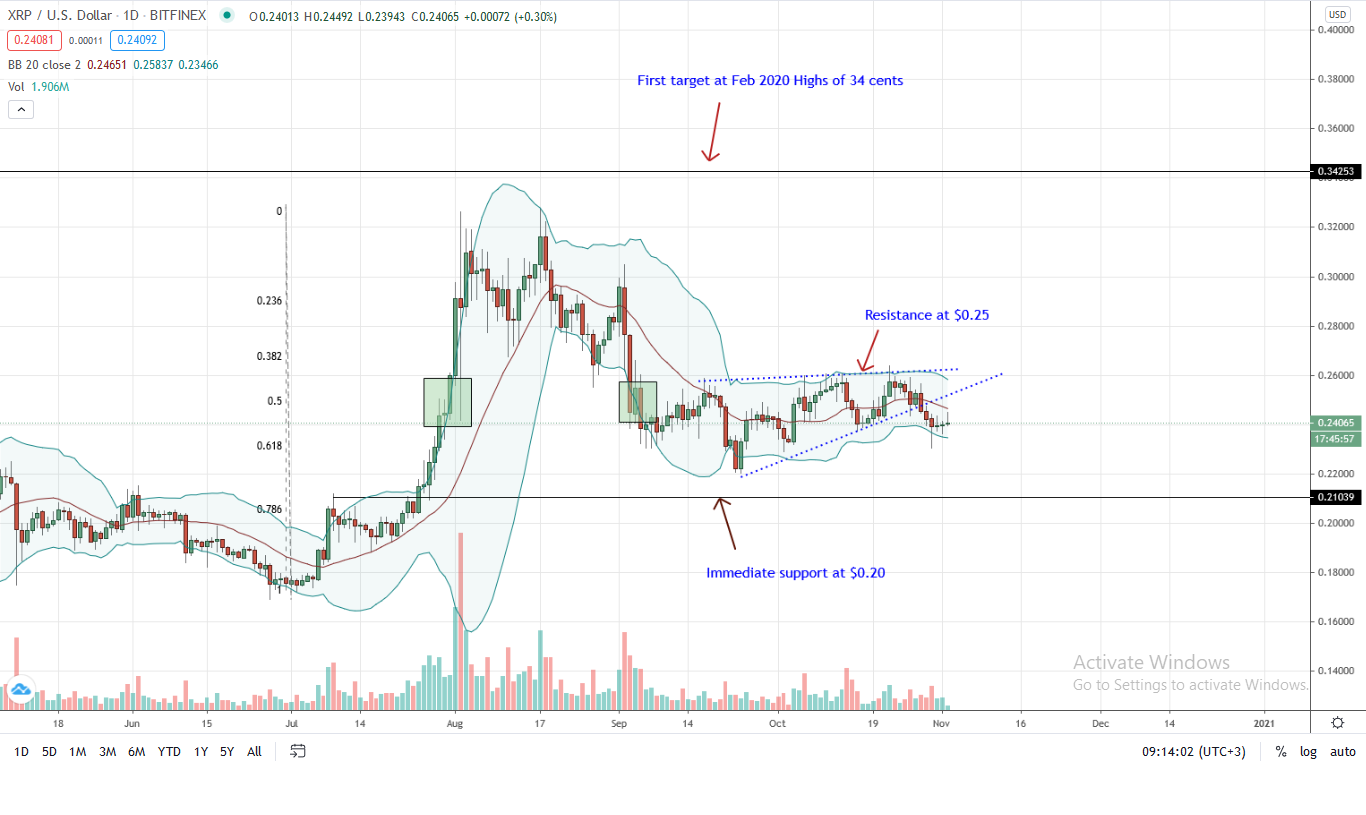
The Ripple price is changing hands below $0.24, down versus the greenback in the last week of trading. Specifically, it trails the USD, BTC, and ETH, five, nine, and two percent, respectively.
Candlestick arrangement in the daily chart suggest weakness. Notably, the Ripple price is trading below a primary support trend line, subsequently confirming steep losses of early September 2020.
The failure of buyers to drive prices above $0.25 and $0.30 in mid-October and the deterioration of prices in late October showed that the initial appreciation of prices were part of a bear flag.
The break below the support trend line was also accompanied by high trading volumes pointing to participation and a possible bear trend continuation. At this pace, the Ripple price may tumble to $0.20 in a retest confirming bears of early October.
Conversely, strong gains above $0.25 could see the Ripple price soar to $0.30 or better in Q4 2020.
Chart courtesy of Trading View
Disclaimer: Views and opinions expressed are those of the author. This is not investment advice. Do your research.
If you found this article interesting, here you can find more Ripple news