Ethereum is wavy, in sync with the rest of the crypto market that’s on the verge of breaking under the weight of sellers.
At the time of writing, the coin is down two percent versus the greenback.
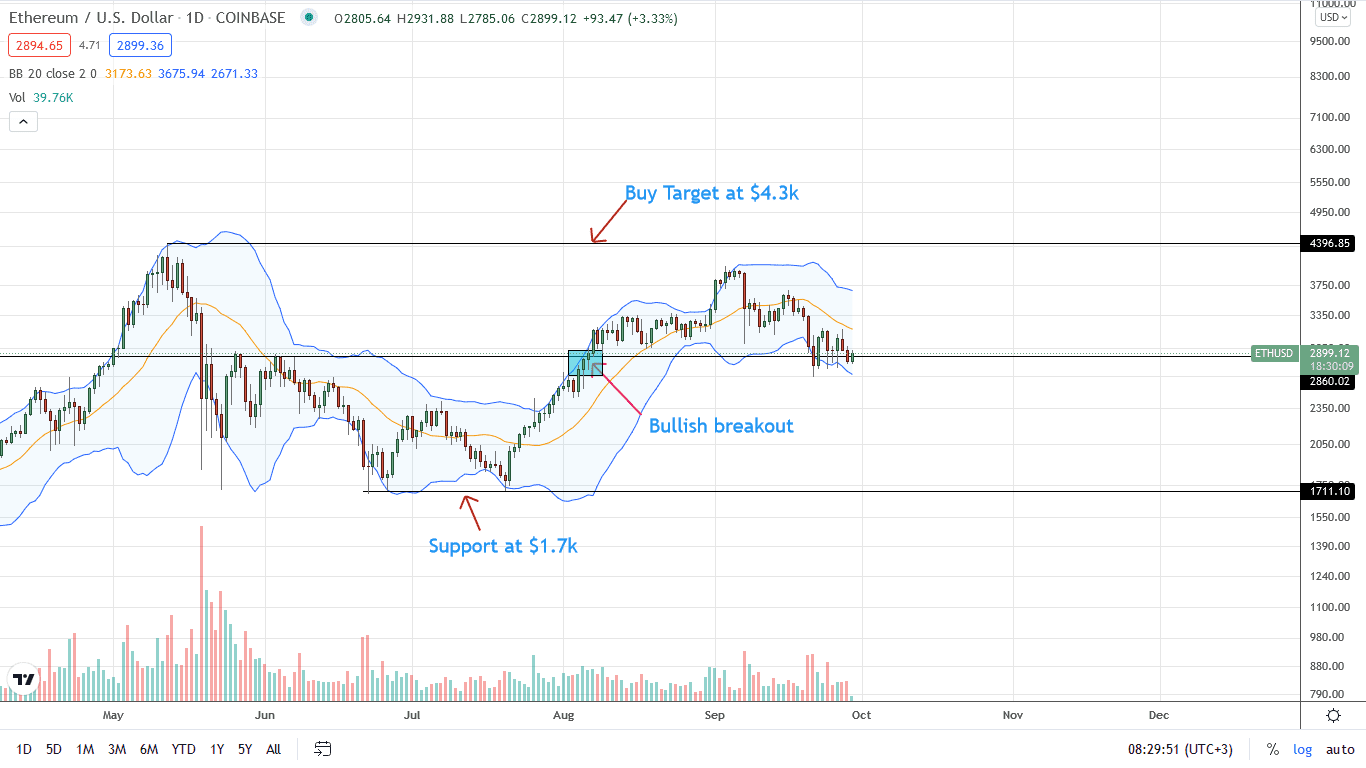
Overall, prices are trending inside a bear breakout pattern, visible in the daily chart.
ETH is a Next-Gen Currency
The general contraction of the ETH price is albeit confidence from permabulls.
Following the activation of EIP-1559, for example, talks of ETH morphing into ultrasound money that’s scarcer than gold and BTC saturated the crypto scene.
Weeks later, the bubbly description and confidence of ETH as the next-gen money functioning as a dual asset, valuable as fuel and money, has been replaced with caution as the coin dangles precariously above a support zone.
Presently, that region lies between the psychological $3k mark and $2.8k to the downside.
NFTs Fueling the ETH Incinerator
The general apprehension in the market is despite the resilience of DeFi and the wild popularity of NFTs.
Data trickling in shows that most ETH burned stems from NFT operations at OpenSea.
The centralized project is single-handedly driving ETH to be ultrasound money faster than the amount of organic ETH transfers or the number of swaps at leading DeFi protocols like Uniswap.
When Uniswap v2 and 2 activities are merged, the DEX becomes one of the most active in the scene.
Nonetheless, as on-chain activity surge, Gas fees remain stubbornly high, sparking innovation and quest to bridge to Layer-2 options offered through Rollups or Sidechains.
Ethereum Price Analysis
At the time of writing, ETH is down two percent versus the greenback on the last trading day.
Although ETH bulls might be confident, market conditions call for apprehension reading from price action in the daily chart.
For example, ETH/USD prices are still trending within a bear breakout pattern set in motion by September 7 bar and confirmed 13 days later on September 20.
The climactic bear bar still defines short-term price action. As per the performance in the daily chart, a drop below $2.8k may see ETH crumble to $2.4—or worse in the days ahead.
On the flip side, a break above the current consolidation at $3.2k and the middle BB may spark demand, lifting ETH towards $3.7k and $4k in short to medium term.
Technical charts courtesy of Trading View
Disclaimer: Opinions expressed are not investment advice. Do your research.
If you found this article interesting, here you can find more Ethereum News