After a “HODLer Test” of last week, Ethereum bulls are back in the picture, shaking off bears and angling to break to new all-time highs in the coming few weeks.
Ethereum Block Gas Limit Increased to 15 Million
Naturally, traders are pinning their hopes on events expected in the next few months.
Already, Berlin is active, and early this week, the Ethereum mining community unanimously decided to raise the block Gas Limit to 15 million. The result was immediate.
Ordinarily, in Ethereum circles, Gas Limit defines the number of operations fitted in a single block.
In light of increasing demand for Ethereum due to NFTs and DeFi, transaction fees due to a lower Gas Limit have been unbearable. The result saw users route their funds through alternate platforms offering near negligible fees and thus boasting a better user experience.
A few days after the change, Gas fees have plunged from $30 per transaction to an affordable $8, a relief for everyday DeFi operators.
DeFi TVL Following ETH Price
At the same time, DeFi TVL immediately rose from $51 billion to $61 billion as of writing on Apr 28. The correlation, as data shows, between DeFi TVL and ETH price is positive and inverse with Gas fees.
With the Ethereum community planning to refine the ecosystem further, tweaking definitive aspects of the network’s parameters aimed at improving the user experience by leveling out upward pressures on Gas via EIP-1559 and Layer-2 solution, the ETH/USD price will highly likely track higher, gaining against both the greenback and BTC.
Ethereum Price Forecast
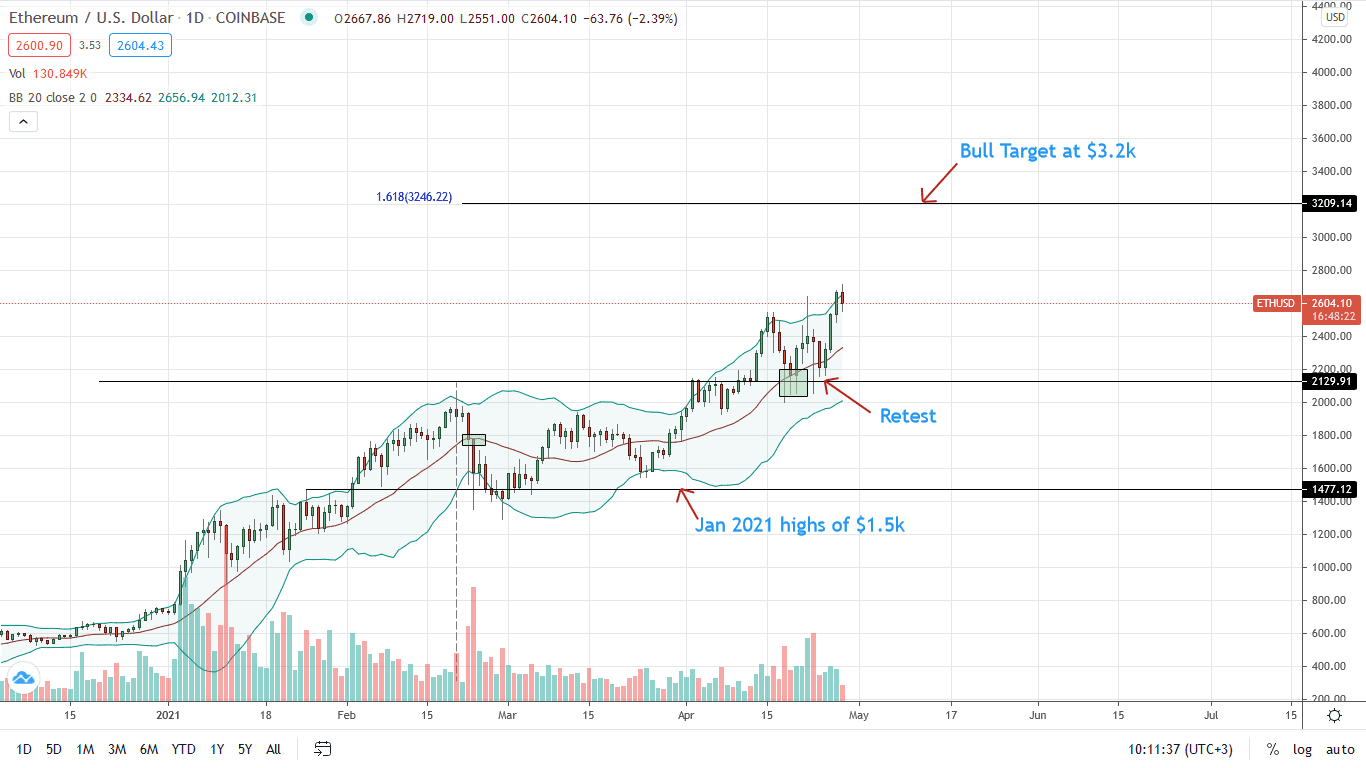
The ETH/USD price is trading at around an all-time high. Analysts are firm, expecting another wave of higher high, lifting the coin above $2.66k to $3.2k.
From the daily chart, the ETH price is trading within a bullish breakout pattern. The 20-day moving average acts as a flexible support level. It could define price action, acting as a loading zone as long as prices chart higher.
Technically, candlestick arrangement favors bulls. Therefore, there might be a chance for aggressive traders to buy the dips above $2.2k with targets at $3.2k—the 1.618 Fibonacci extension level of the Q1 2021 trade range.
Risk-averse traders may enter if there is a comprehensive break above $2.67 with high trading volumes.
Note, the retest of last week proved ETH/USD bulls’ determination.
Accordingly, the level acts as another critical support level. If broken, ETH/USD may slide back below $2k.
Chart Courtesy of Trading View
Disclosure: Opinions Expressed Are Not Investment Advice. Do Your Research.
If you found this article interesting, here you can find more Ethereum News


