
Ethereum and Bitcoin are fundamentally different. It may be about functionalities but the main divergence that’s sparking debate is on the former’s flexible supply.
The Ethereum Total Supply Debate
Unlike Bitcoin, Ethereum’s total supply is dynamic, increasing with time due to the project’s continuous improvement requirements and factoring in on the developers’ fund. Developers form a critical part of any open-source blockchain.
They must be incentivized to channel their work otherwise a blockchain would lag amongst its peers and be susceptible to the ever scheming agents.
For a multi-billion project as Ethereum, the developer fund is part of the total supply. Though expected to expand faster, its rate has been slow and the total supply in the Proof-of-Work setup is lower but a source of criticism.
Over the weekend, as supporters of the two most valuable chains clashed, Ethereum developers created a tracker that will instantaneously display the total supply of ETH including Genesis and Uncle rewards.
ETH Options Valuation rose 6X
Meanwhile, the excitement around ETH’s stellar performance is drawing more users to the second most valuable coin.
Statistics indicate that in the last few weeks, ETH has continuously outperformed BTC thanks in part to the community’s expectations.
Hinting of demand is statistics from ETH options which rose 5X in the past three months to $337 million. It may pale in comparison to the more developed BTC options but currently, the total valuation of ETH options stands at where BTC options stood at 15 months ago.
Ethereum Price Analysis
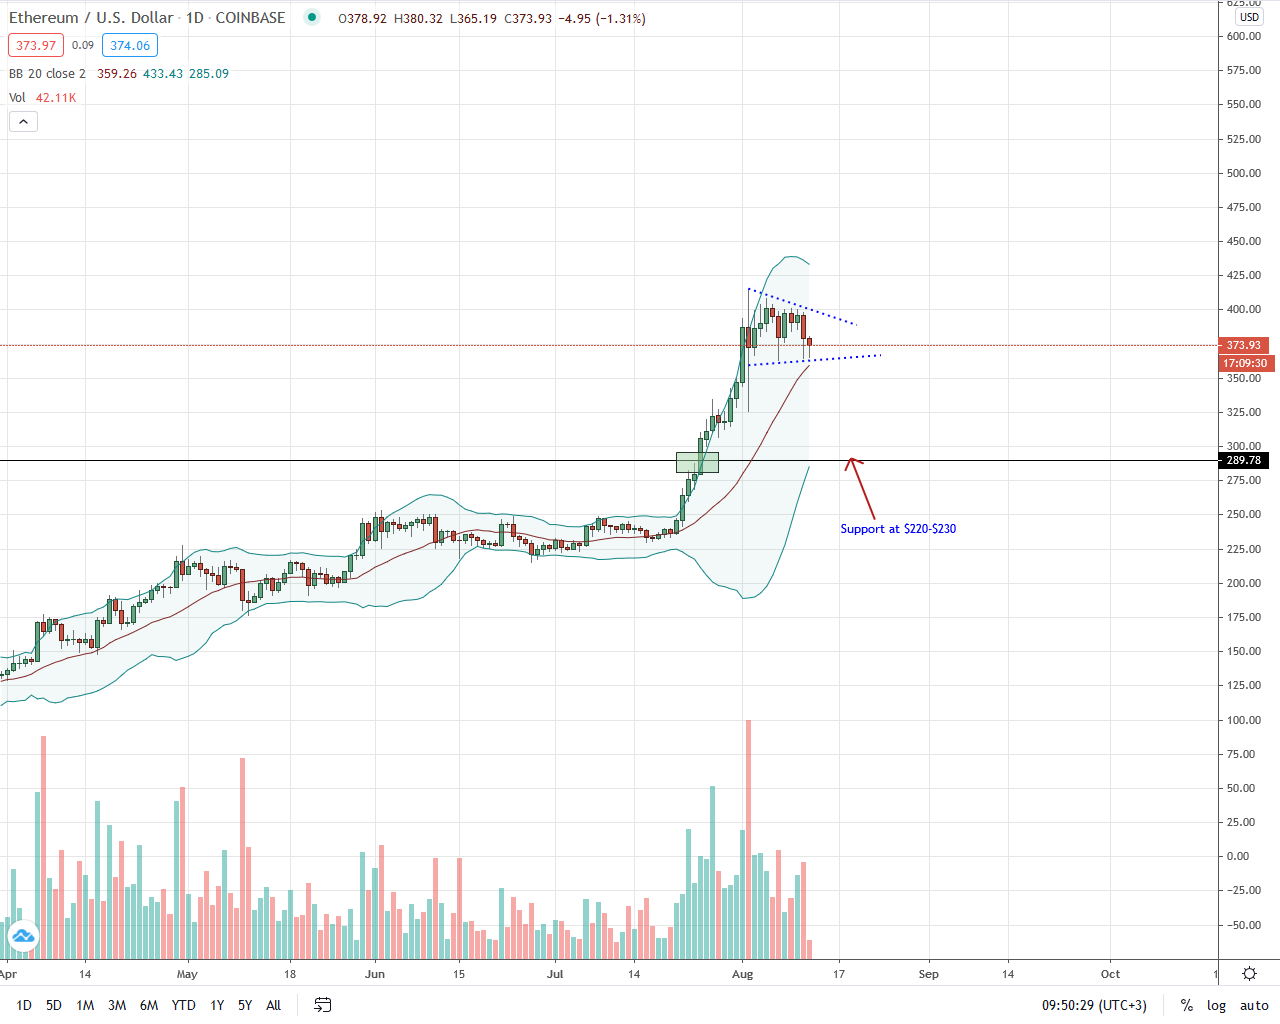
After a near perpendicular rise, the Ethereum price is in consolidation below $400. Fairly stable against the USD, it is beginning to cede ground against BTC in the last trading week.
Nonetheless, the failure of bears to break below the main support trend line (or the bull flag) means there is a chance of bulls edging higher.
Regardless of candlestick arrangement, the general expectation is a likelihood of a pullback more so if there is a sharp close below $360 or Aug 7 lows.
From the daily chart, Aug 2 high of $410 is the immediate resistance line. A close above this mark will effectively extinguish bearish attempts and even set in motion the next wave of bulls that may push the Ethereum price to new 2020 highs.
At the moment, aggressive traders can place positions to sync with the trend with stops at around $360 or the middle BB. Dips below $360 may see the ETH price sinking to $300 in a retest.
Technical Chart courtesy of Trading View.
Disclaimer: This is not investment advice. Opinions expressed here are those of the author and not the view of the publication.
If you found this article interesting, here you can find more Ethereum News