The Ethereum network processes three to four times the number of transactions in Bitcoin, highlighting just how dominant the platform is and the demands associated with asset tokenization.
Unlike Bitcoin, it is possible to do more than just transfer value from one wallet to another in Ethereum. Through the smart contracting network, users can not only tokenize their assets, launch projects, but also simply move value from one user to another.
This explains why while the network processes 3X the amount of transactions in Bitcoin–helping generate its miners with millions of dollars, its network remains congested.
At the time of writing, the Ethereum network utilization stood at 97 percent and transaction fees were comparatively higher than Bitcoin though it has noticeably fallen from Sep 2020 highs.
The shrinking Gas fees could be because the euphoria around DeFi is falling but it can also be because of Layer-2 solutions like Optimistic Rollups which has the support of Vitalik Buterin.
A few days back, the co-founder said the Ethereum roadmap can even be tweaked so that developers can in the immediate term focus on Rollups as a way of scaling the network.
Already, several “heavy” dApps in DeFi plan to shift to Layer-2 and help vent the network from the huge demand.
The more Rollups is adopted and fine-tuned to meet the rigors of network users, the more the average transaction fees will likely fall to tenable levels which will in turn benefit the entire application class in Ethereum. Some even shut down as DeFi forced fees through the roof.
Ethereum Price Analysis
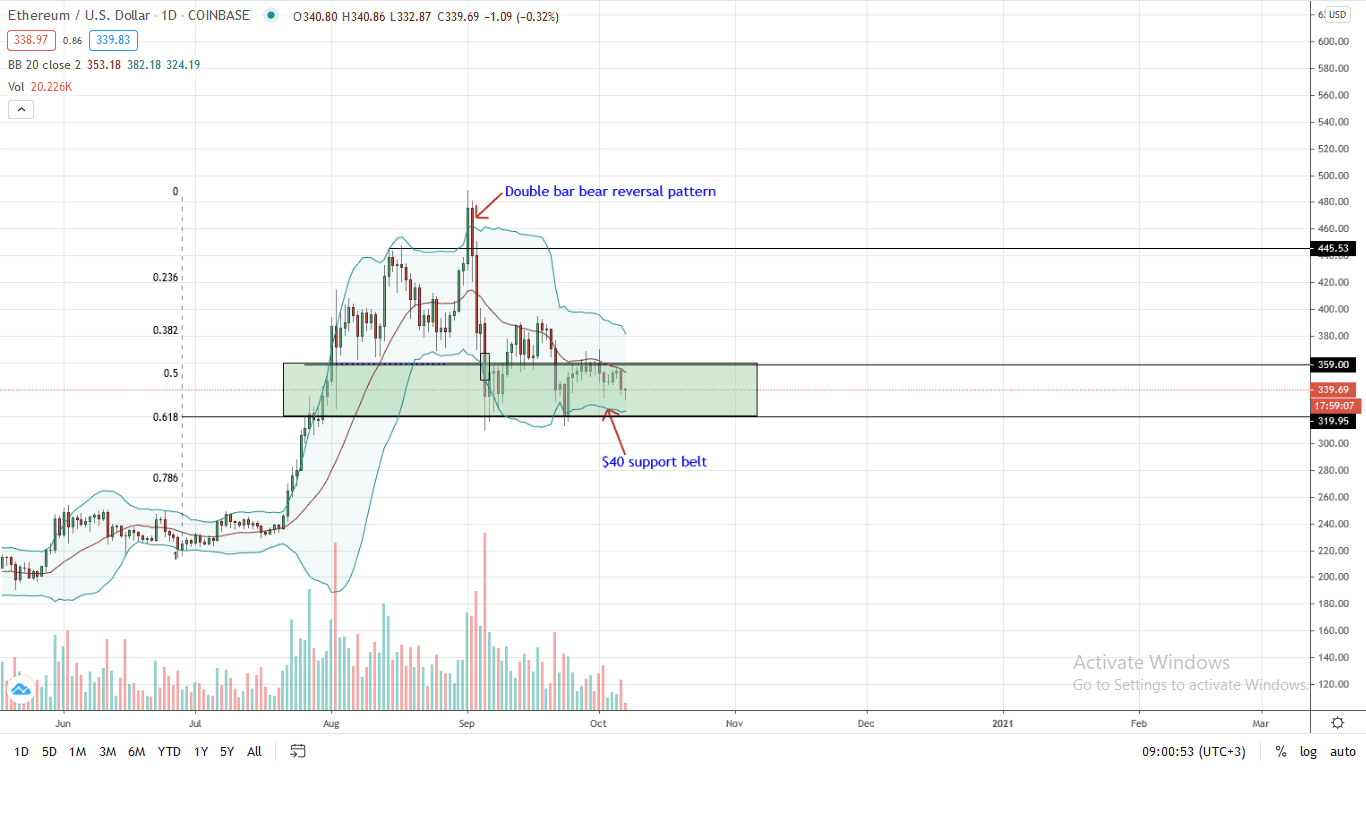
The Ethereum price continues to wave, moving inside a $40 support belt with immediate caps at $370 and $320.
Although market participants are bullish, candlestick arrangement suggests weakness. Notably, yesterday’s candlestick was bearish, sharply reversing from the middle BB—the 20-day moving average.
The rejection of higher prices moved price action to within a descending triangle and squarely inside Sep 5 bear candlestick. Noted, as long as prices are held inside this bear candlestick, sellers are in control from volume analysis.
In the immediate term, the path of least resistance is southwards with supports at $320. Ideally, any break below $320 could trigger a correction back to $250 or worse in the medium term.
On the flip side, a break above this consolidation to $380 or $400 could see ETH prices soaring to $480 or new 2020 highs by the end of the year.
Risk-averse traders can stay neutral until a definite trend is established.
Chart courtesy of Trading View
Disclaimer: Views and opinions expressed are those of the author. This is not investment advice. Do your research.
If you found this article interesting, here you can find more Ethereum News