TL;DR
- XRP trades at $1.45 after falling 60% from the $3.66 peak.
- The key level for sustained recovery sits between $1.80 and $2.00.
- Standard Chartered projects $7 in 2027 and $28 by 2030.
XRP trades near $1.45 after falling 60% from the $3.66 high recorded in July 2025. The correction extends from the fourth quarter of last year and keeps broader price structure under pressure. However, the analyst known as Chart Nerd maintains that the long-term structure remains intact and continues to project targets at $8, $13, and $27, levels that closely align with updated forecasts from Standard Chartered.
In the short term, the four-hour chart showed a breakout above the $1.50 neckline, linked to an “Adam and Eve” bullish reversal pattern. Price advanced to $1.67, yet failed to reach the projected range between $1.81 and $1.82. Momentum faded shortly after, and XRP slipped back below the breakout zone, weakening immediate bullish confirmation. Moreover, the asset did not secure firm closes above $1.50, a condition the analyst considered necessary to validate continuation.
For 5 years, my conviction in $XRP has been anchored by 3 specific targets: $8/$13 and $27 🎯 these weren’t "Magic Hat" predictions 🐇 they were derived from Disciplined Analysis of Historical Data and Market Cycles. Conviction? I could wait another 5. Trust the process 📅 https://t.co/s3kRzNL50t pic.twitter.com/YWcioPxOcs
— 🇬🇧 ChartNerd 📊 (@ChartNerdTA) February 17, 2026
The technical projection measured the distance between the neckline and the V-shaped recovery low, then extended that range upward from the breakout point. Even so, the rejection raised questions about a liquidity sweep that trapped both long and short positions. Recent volatility supports that interpretation, as XRP climbed from $1.34 to $1.60 before the failed breakout attempt.
Key Support Levels and Medium-Term Structure
Chart Nerd states that XRP trades within a mid-range structure marked by sharp drops followed by swift recoveries. According to his view, repeated V-shaped rebounds indicate recurring liquidity hunts. In addition, liquidity heat map data shows dense buy-side orders stacked between $1.60 and $2.00, with heavier concentration above $1.80.

After another rejection near $1.50, price may revisit the ascending trendline to print a higher low before attempting a renewed breakout. If XRP maintains closes above $1.20, a level linked to the February 5 candle close, the higher-low structure remains valid. Conversely, a sustained loss of local support increases the probability of a deeper retracement toward $0.70, which the analyst identifies as a broader structural support.
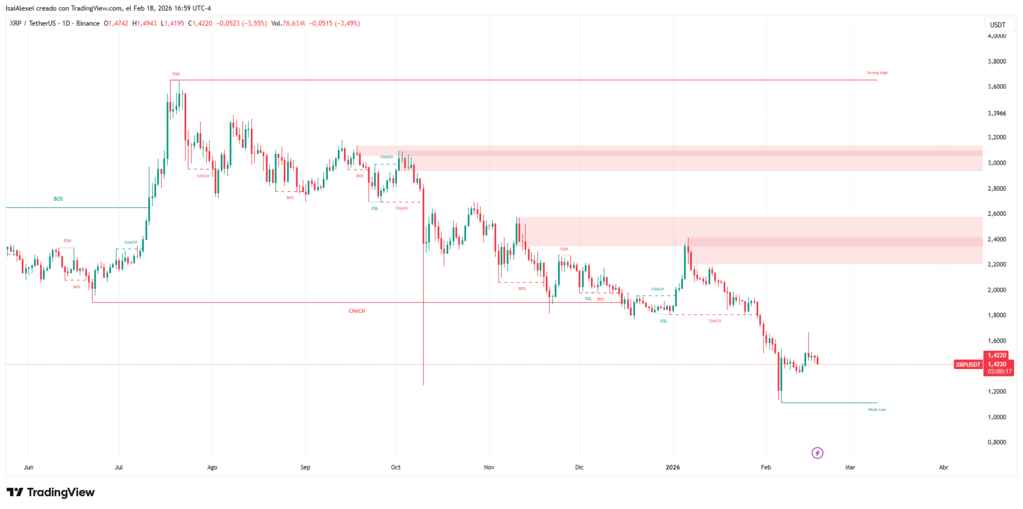
On higher timeframes, the $1.80 to $2.00 range stands as a decisive threshold. For over a year, the market defended that band as support before losing it, a breakdown that preceded the decline to $1.11 earlier this month.
A firm recovery and sustained hold above that range would reinforce the bullish thesis and strengthen the case for new all-time highs within the current cycle. On the other hand, rejection in that zone would maintain structural selling pressure.
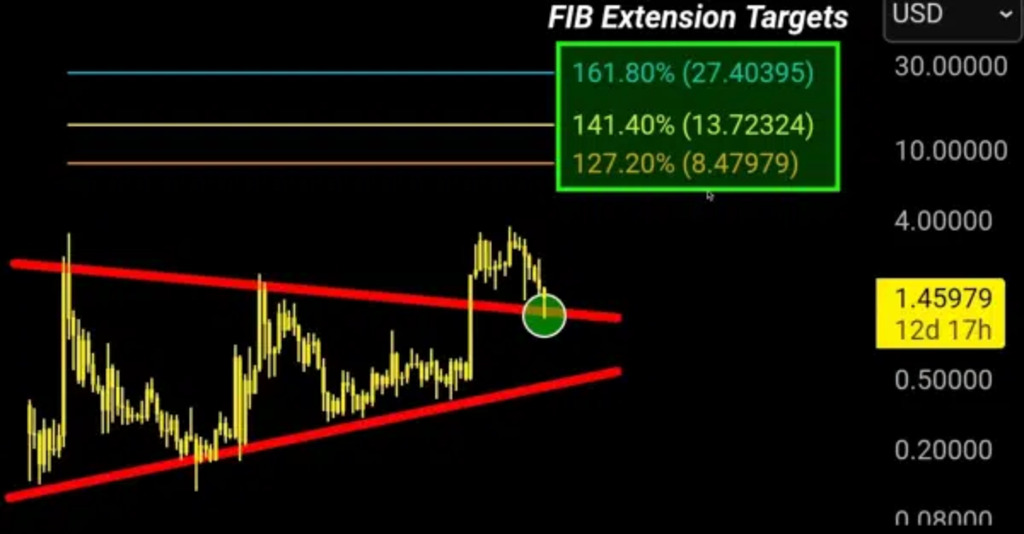
Standard Chartered projects an average XRP price near $2.80 in 2026, alongside long-term targets of $7 in 2027, $12.60 in 2028, and $28 by 2030. The bank lowered prior projections, which brings estimates closer to current market conditions. Chart Nerd compares those figures with Fibonacci extensions drawn from the 2020 low to the 2018 all-time high and highlights the close alignment with his own levels at $8, $13, and $27.
The analyst acknowledges that projections do not guarantee outcomes. Still, he notes that in previous cycles XRP reached the 1.272, 1.414, and 1.618 Fibonacci extensions before completing expansion phases.