TL;DR
- Bitcoin’s Realized Cap Nears ATH: Bitcoin’s realized cap, which reflects its true value, is currently 5.4% below its previous all-time high (ATH) of $467 billion.
- Slow Recovery in Current Cycle: The recovery speed of Bitcoin in the current market cycle (2023-24) has been slower than in previous ones.
- Steady Trading Range in 2024: Despite periodic peaks and troughs, Bitcoin has maintained a steady position within a $5,000 price range.
Glassnode, a prominent platform for on-chain and financial metrics, reports that the realized cap of Bitcoin is currently 5.4% below its previous all-time high (ATH) of $467 billion. It has been noted by the analytics platform that there is a significant influx of capital into the premier cryptocurrency.
The #Bitcoin Realized Cap remains just -5.4% shy of its previous ATH of $467B, and is currently experiencing strong capital inflows.
That said, the duration for this recovery to accelerate has been markedly slower than prior cycles, arguably due to the significant supply… pic.twitter.com/UfPdDiN6AG
— glassnode (@glassnode) February 1, 2024
In a recent update, Glassnode pointed out that Bitcoin’s recovery speed in this cycle has been noticeably slower than in previous ones. The analytics platform posits that this could be due to a significant supply overhang resulting from complex trades such as the Grayscale GBTC arbitrage.
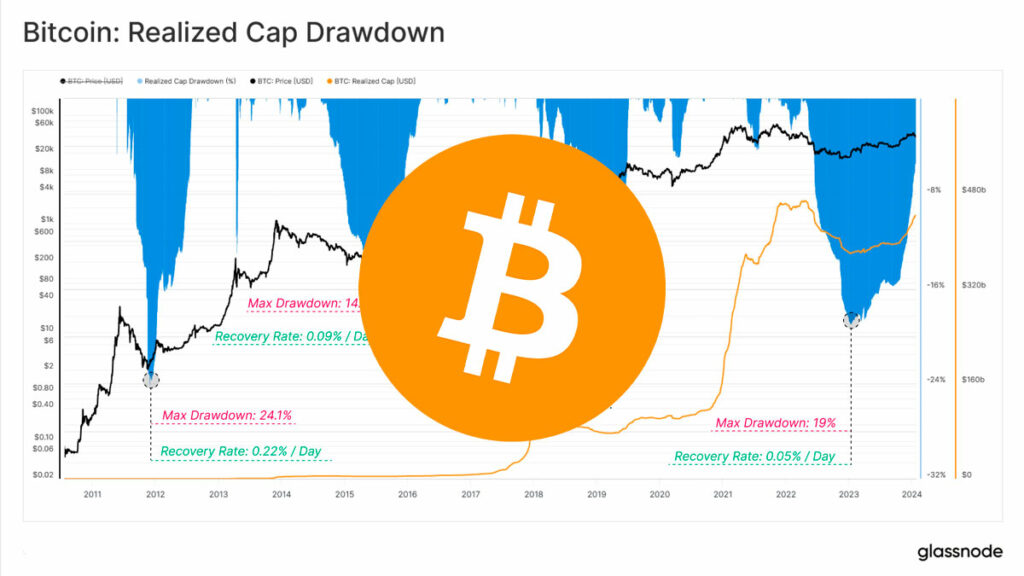
Historical data from Glassnode reveals that the daily rate of Bitcoin’s realized cap was 0.22% in the 2012-13 market cycle, 0.09% in the 2015-16 cycle, and increased to 0.17% in the 2019-20 cycle. However, in the most recent 2023-24 market cycle, the daily rate of Bitcoin’s realized cap has further decreased to 0.05%.
Bitcoin’s Realized Cap Reflects its True Value
It’s important to understand that Bitcoin’s realized cap offers a view of the cryptocurrency’s true value, taking into account the price at which each Bitcoin was last moved. This differs from the standard Bitcoin market capitalization as the realized cap considers the historical movement of Bitcoins, disregarding those that have not been active.
A chart included in Glassnode’s post indicates that Bitcoin’s realized cap is typically seen making a sharp upward recovery. This pattern implies that the leading cryptocurrency is in a bull market, as per the information available on Glassnode’s website.
Bitcoin has demonstrated consistent behavior in 2024, maintaining a steady position within a $5,000 price range despite periodic peaks and troughs. As of February 2, 2024, Bitcoin has traded between $40,000 and $44,999 for nearly 150 days, contradicting predictions of a more expansive price movement.
At the time of writing, Bitcoin was trading at $43,130, recovering from a recent dip to $38,505, as per data from CoinMarketCap. The foremost cryptocurrency maintains its position above the crucial $40,000 threshold, with market participants anticipating a further upward movement in anticipation of the forthcoming Bitcoin halving.