Since last week the market has presented an interesting fall, bitcoin fell about 16%, since May 21. According to Coin Market Cap the market capitalization went from being close to 390,000 million dollars to 324,000 million dollars, a decrease of more than 66,000 million dollars until the present moment and it has created wide repercussions in the alternative currencies, also named Altcoins. This said, let’s see what happened this week in the Top 10 Ranking according to Coin Market Cap.
Bitcoin, BTC / USD
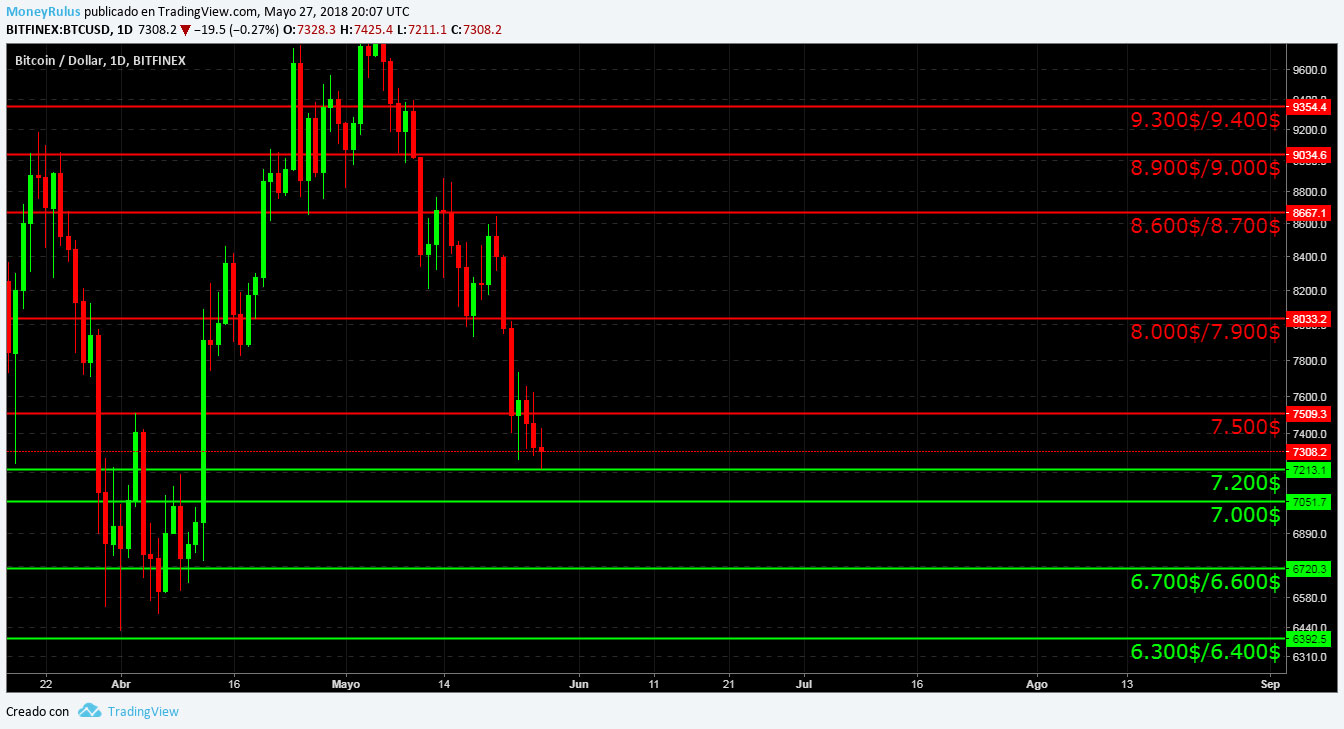
Observing the BTC / USD pair in the BitFinex exchange house, it can be seen that the price quotes show a rising green channel, which has been consistent for some months and has been slightly modified since last week. At this moment the price is touching the lower part of said channel, being flexible with the market the channel is still valid, so it is possible that it makes a rebound to the top of it. Besides, when drawing the trend line (yellow) using the 3 most important maximums of this year, it is visible that the price continues to respect the resistance that this line represents. The volume is low, signal of little strength in the market, although the drop in the price has been palpable.
- If BTC decides to increase in price, resistance can be found in the areas of $ 7,500, $ 8,000 / $ 7,900 (a psychological level), $ 8,600 / $ 8,700, $ 8,900 / $ 9,000 (another psychological level) and 9,300 $ / 9,400 $. Remember that a broken support tends to become a resistance.
- In BTC, if it continues the bearish course, it can find supports in the areas of $ 7,200, $ 7,000, $ 6,700 / $ 6,600 and $ 6,300 / $ 6,400, all psychological levels. The ideal is to wait and react as necessary.
Ethereum, ETH / USD
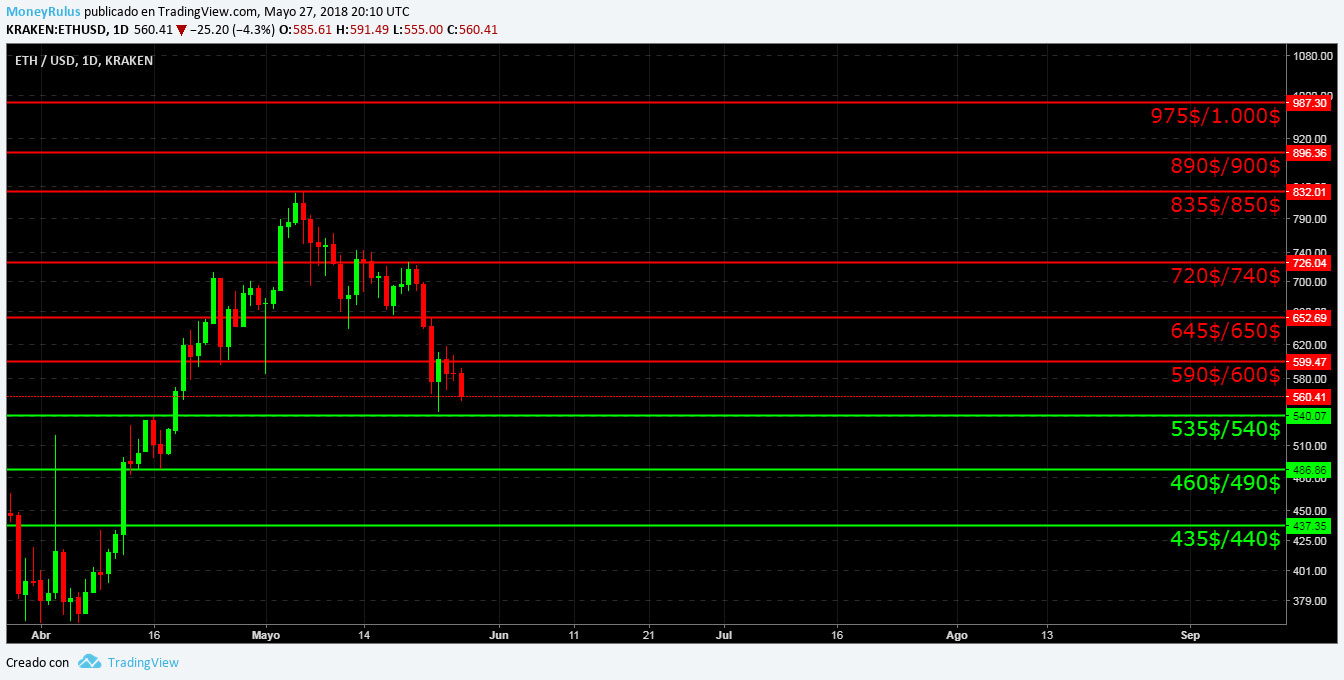
The pair ETH / USD in the Kraken exchange house, shows something analogous to the ascending channel seen in BTC, only that, instead of being touching the lower part of the ascending channel, is approaching it. Separately, when drawing the trend line (yellow) using the last 2 highest maximums during the year so far, it can be seen that the line remains as a standing resistance. The volume is also low, showing weakness so far, although it is true that in the previous days it was greater.
- In case of a rebound, the currency can find resistance at $ 590 / $ 600, $ 645 / $ 650, $ 720 / $ 740, $ 835 / $ 850, $ 890 / $ 900 and $ 975 / $ 1,000, all psychological levels. Several of them, old supports.
- If ETH decides to lower the price, you can find nearby supports in the areas of $ 535 / $ 540, $ 460 / $ 490 and $ 435 / $ 440.
Ripple, XRP / USD
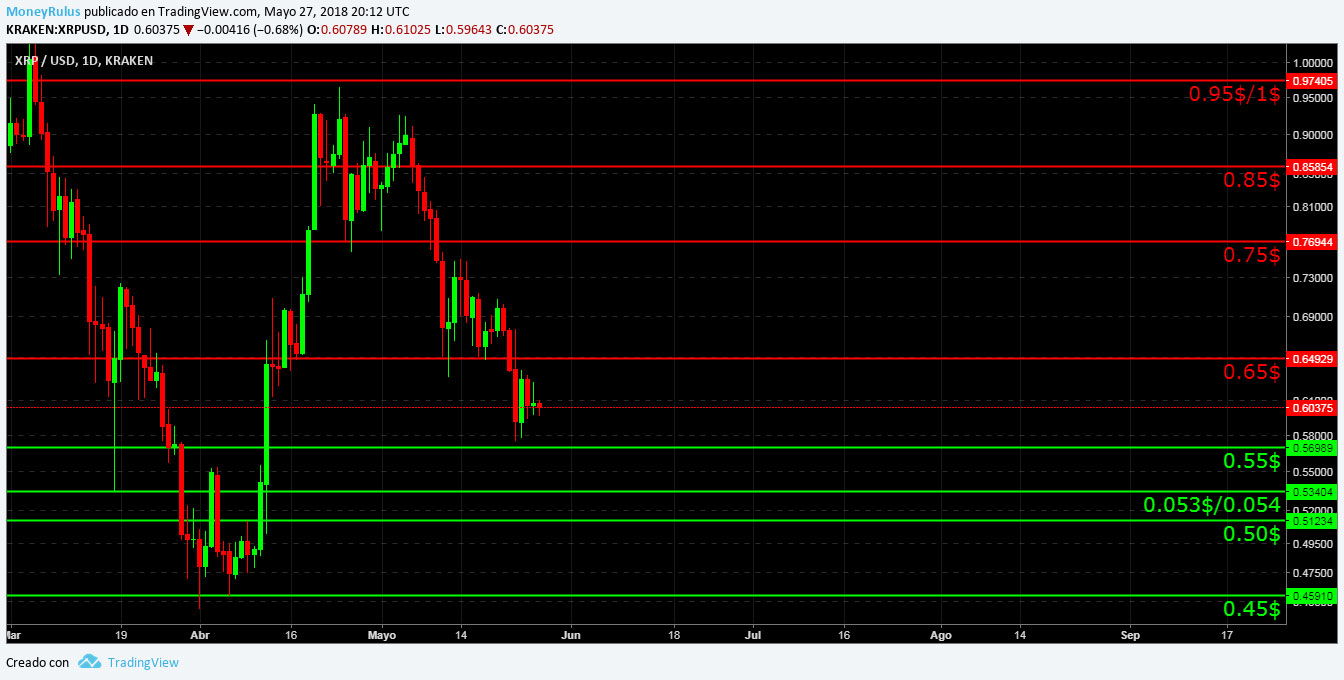
The pair XRP / USD in the Kraken exchange house, continues forming the symmetrical triangle (pattern of continuation) of great size of which already was mentioned, the volume has diminished gradually with the advance of the pattern, that is to say it supports (see pink line ). This pattern indicates the possibility of continuation of the upward trend, so if it is broken upwards (with strength), the upward trend line (green line), could serve as support in the future (dotted green line).
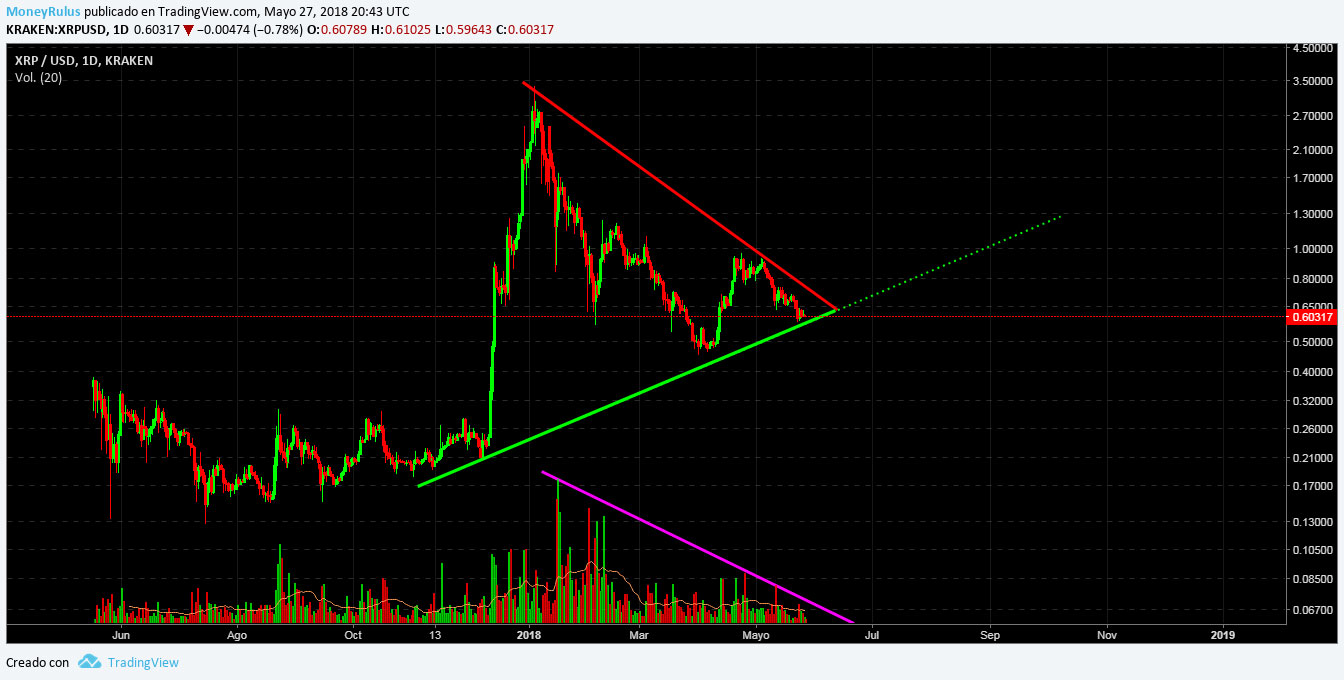
- In case of taking an upward course, the currency may find resistance in the $ 0.65 , $ 0.75 , $ 0.85 and $ 0.95 / $ 1 zones. The resistances remain almost intact.
- Possible supports can be seen in the areas of $ 0.55, $ 0.53 / $ 0.54 and $ 0.45.
Bitcoin Cash, BCH / USD
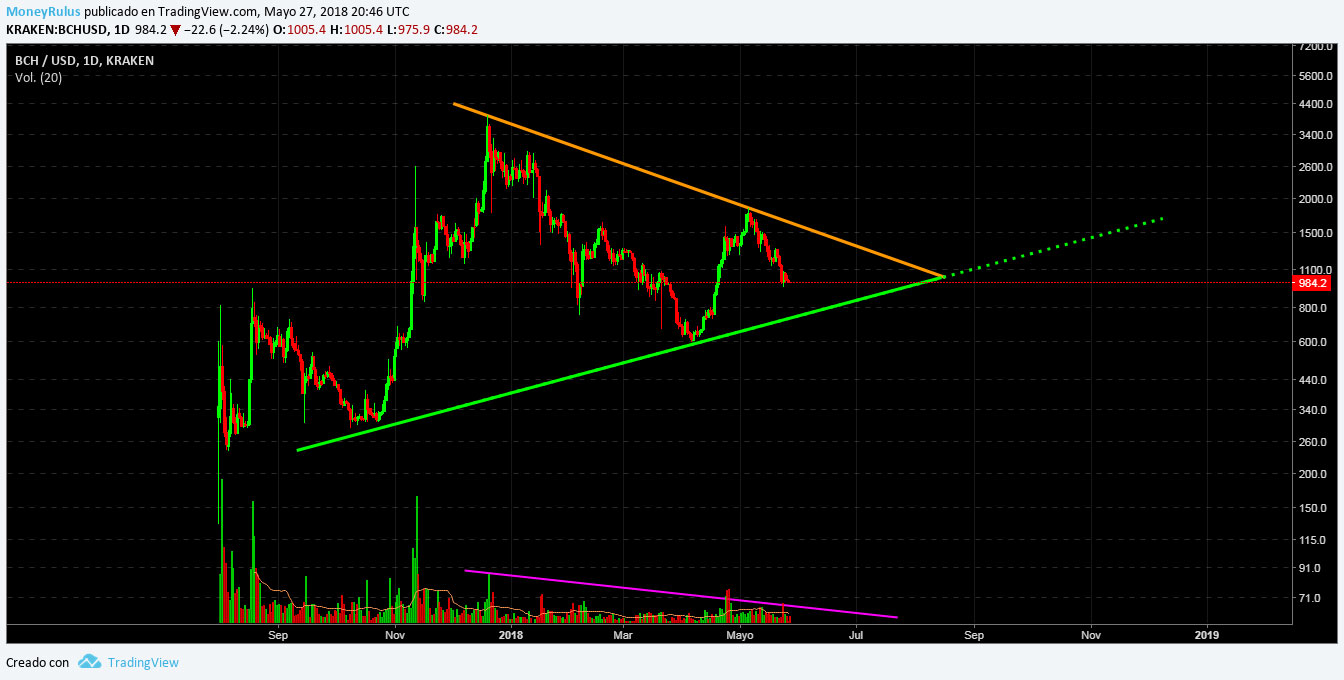
The pair BCH / USD in the Kraken exchange house, shows the same symmetrical triangle similar to the XRP / USD pair. It is a large pattern as we have seen, the volume has gradually decreased with the advance of it (see pink line ), meaning it supports, this pattern as we know is very interesting. In addition to that, we must remember the fractal that is located to the left of it (last week this aspect was explained a little), as a reminder of the existing potential.
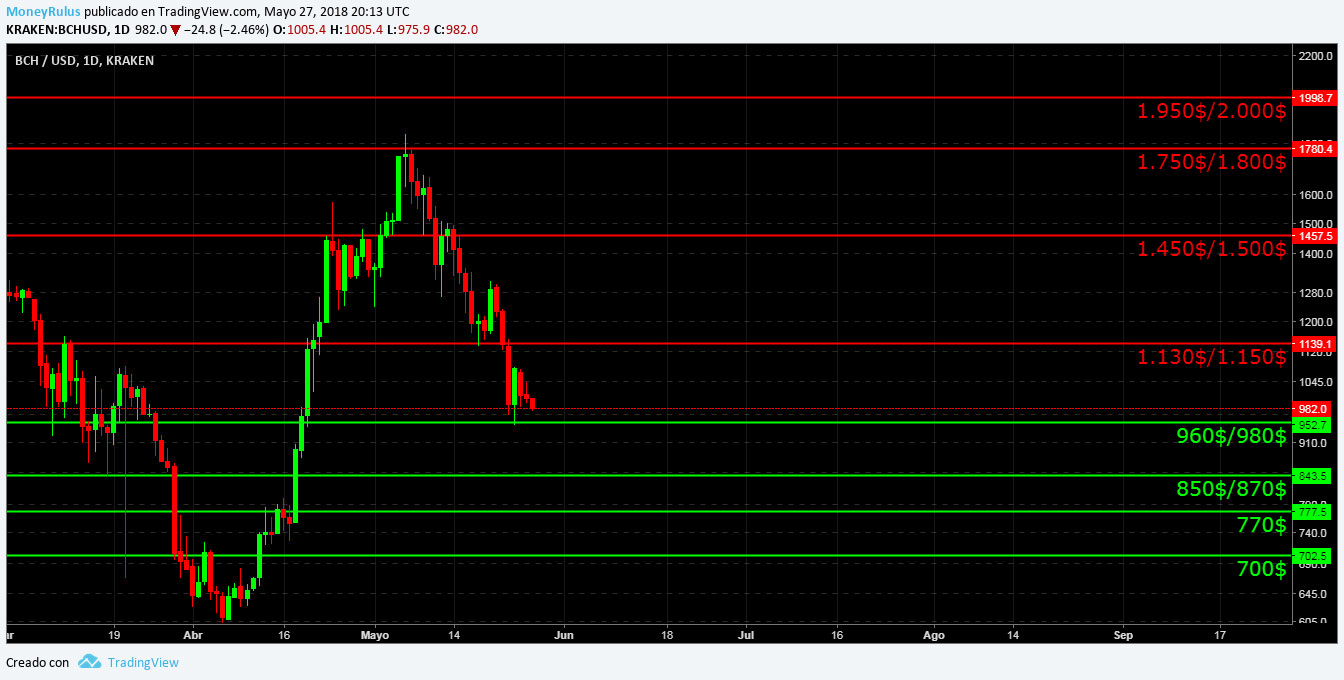
- In case of rising, BCH can find resistances in the areas of $ 1,130 / $ 1,150, $ 1,450 / $ 1,500, $ 1,750 / $ 1,800 and $ 1,950 / $ 2,000 (psychological level that is still vital).
- If the pair goes down, you can find supports in the areas of $ 960 / $ 980, $ 850 / $ 870, $ 770 and $ 700 (an important psychological level, no doubt).
EOS, EOS / USD
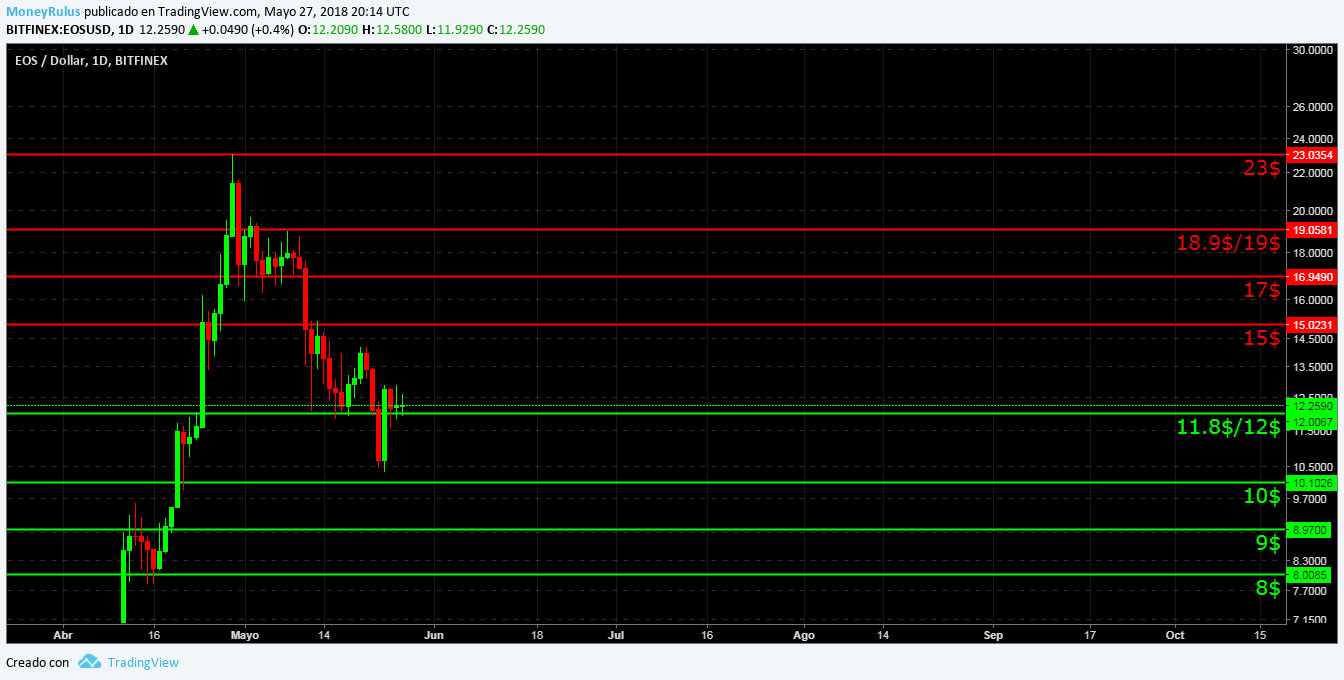
The pair EOS / USD in the BitFinex exchange house, remains on the line of upward trend since last week (green line), and continues to show the same Cup & Handle pattern (bullish pattern) that we have already seen, so the trend it still retains strength in it. The volume shows an ideal support (see pink lines), practically traced from the initial theory which adds a lot of seriousness to the possible bullish pattern, and the fact that it remains strong only strengthens this reasoning.
- In case of a rebound, the pair can find resistance in the areas of $ 15, $ 17, $ 18.9 / $ 19 and $ 23 (the historical maximum). Resistances remain intact since last week.
- At the same time, in the event that the descent continues, the zones of $ 11.8 / $ 12, $ 10, $ 9, and $ 8 may serve as supports, important psychological levels. The area of $ 11.8 / $ 12, was broken but then the price rested on it, so it became a support.
Litecoin, LTC / USD
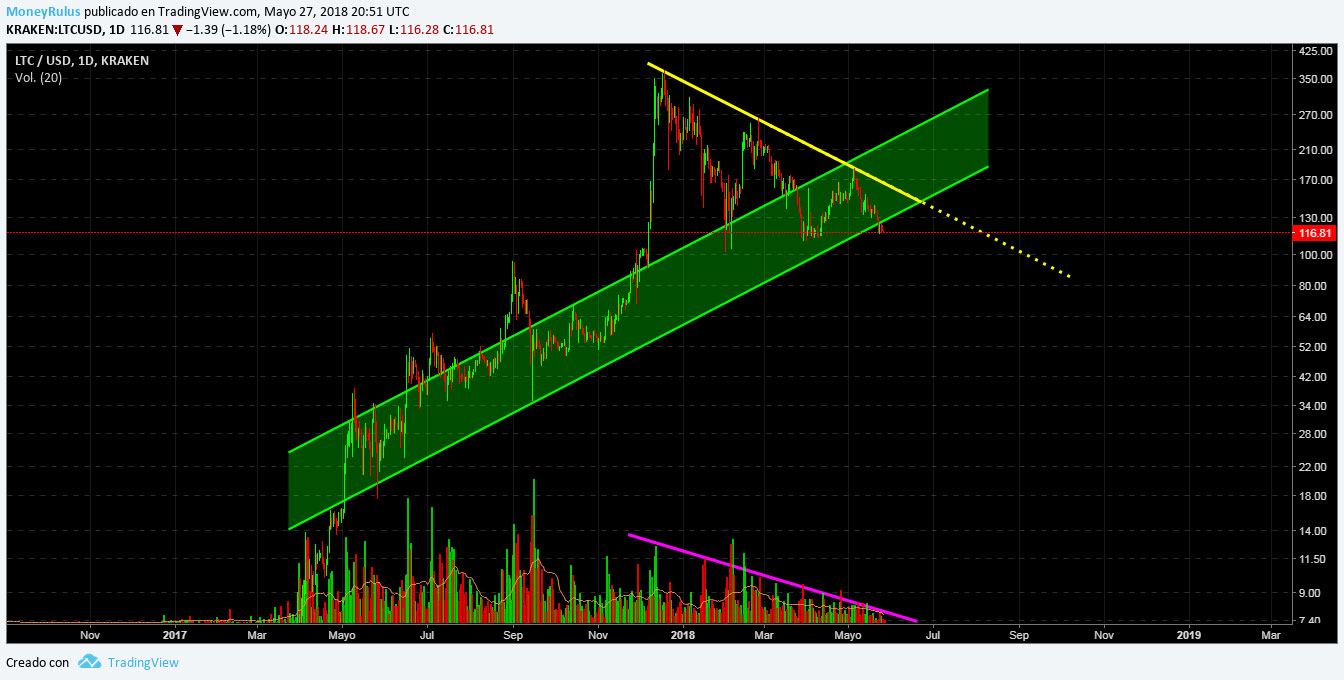
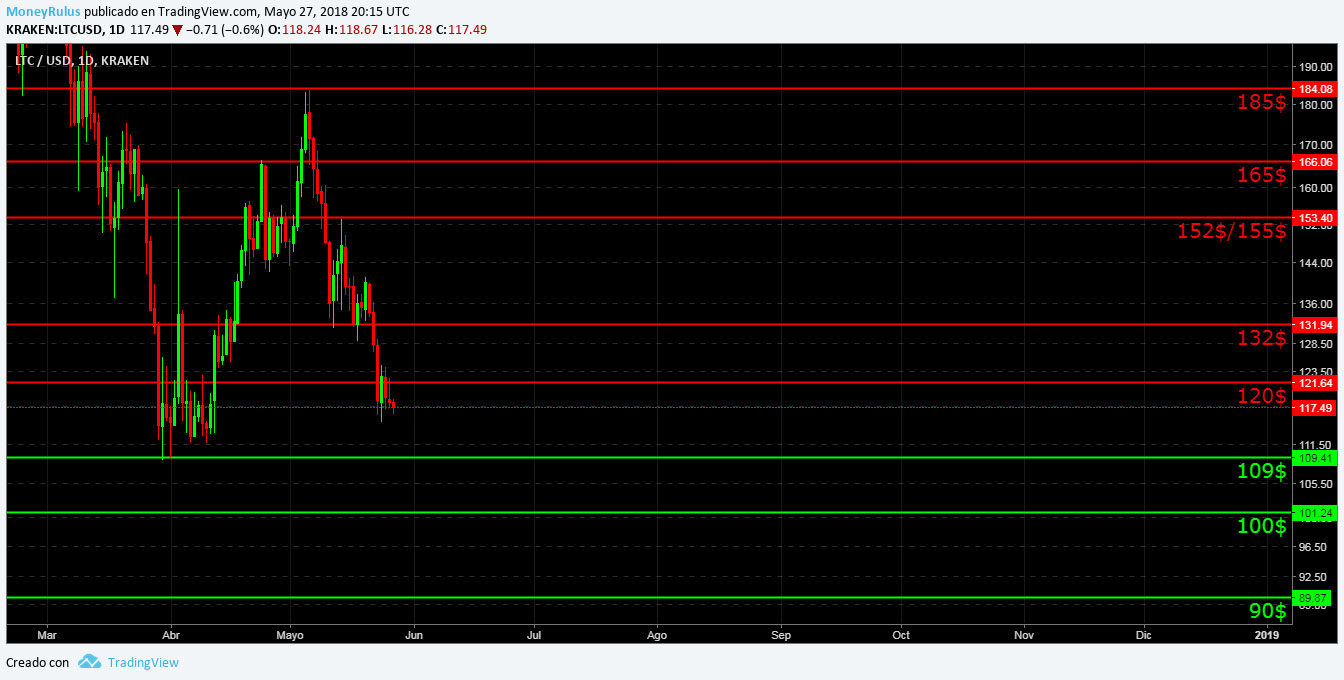
The LTC / USD pair in the Kraken exchange house shows a possible symmetric triangle pattern that remains in force, supported by the volume (see pink line), which adds some reliability to the continuation pattern already studied, that is, to the bullish pattern. Besides that, the price is currently in the ascending channel, and it seems that it is trying to break the bottom of it. Even so, the ideal is to wait to see if it is just a puncture of the market, or if its a really trustworthy break.
- If it remains in the downside movement, it can present certain areas as supports, close to $ 109, $ 100 and $ 90. Supports that are at the same time psychological levels.
- As resistances, the areas of $ 120, $ 132, $ 152 / $ 155, $ 165 and $ 185. The vital areas have diverse resistances.
Cardano, ADA / USDT
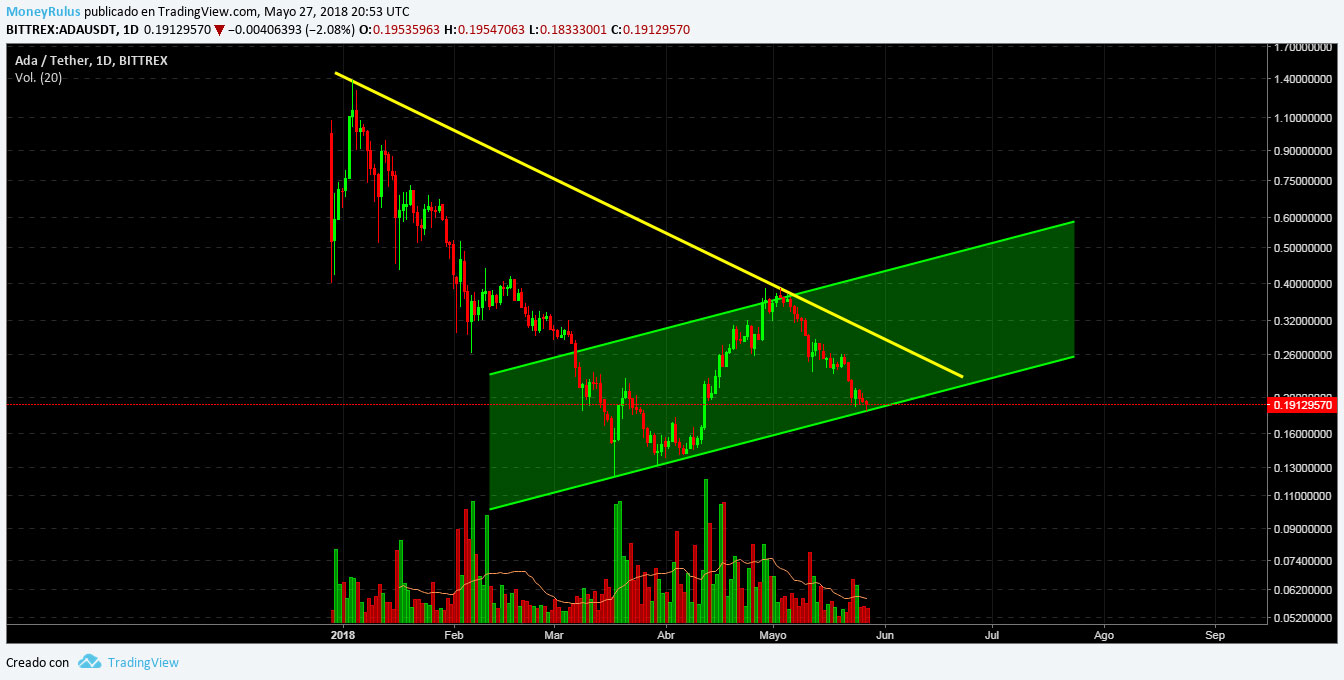
The ADA / USD pair in the Bittrex exchange house shows an extended ascending channel (respecting the one shown previously), at the moment it is in the lower part of the channel (which is the previous one, a bit flexible), so it could bounce and go to the top, the same order of ideas can continue to form the Cup & Handle pattern (as in the present EOS). The volume shows weakness, as in other currencies, so it can infer lack of strength.
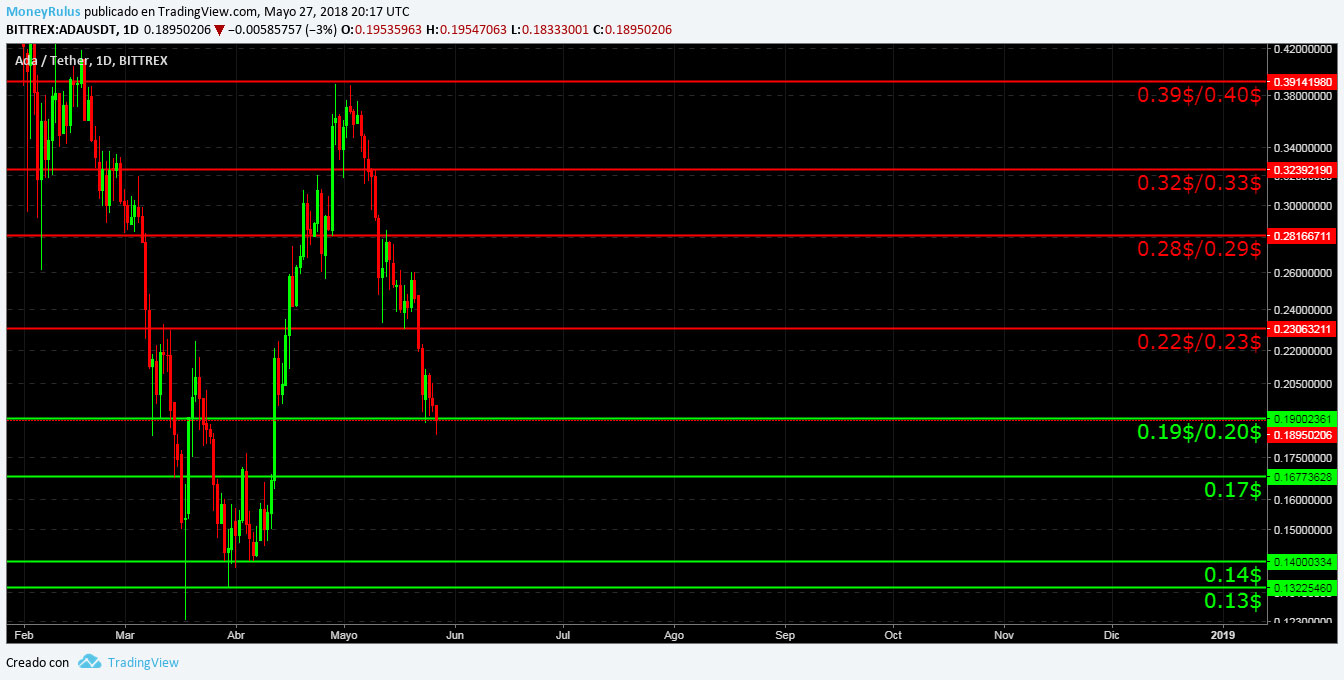
- Resistances are presented in the areas of $ 0.22 / $ 0.23, $ 0.28 / $ 0.29 , $ 0.32 / $ 0.33 and $ 0.39 /$ 0.40, all resistances close to psychological levels and of an interesting importance.
- There are supports in the areas of $ 0.19 / $ 0.20 (psychological level), $ 0.17 , $ 0.14 and $ 0.13 , these areas are vitally important.
Stellar Lumens, XLM / USD
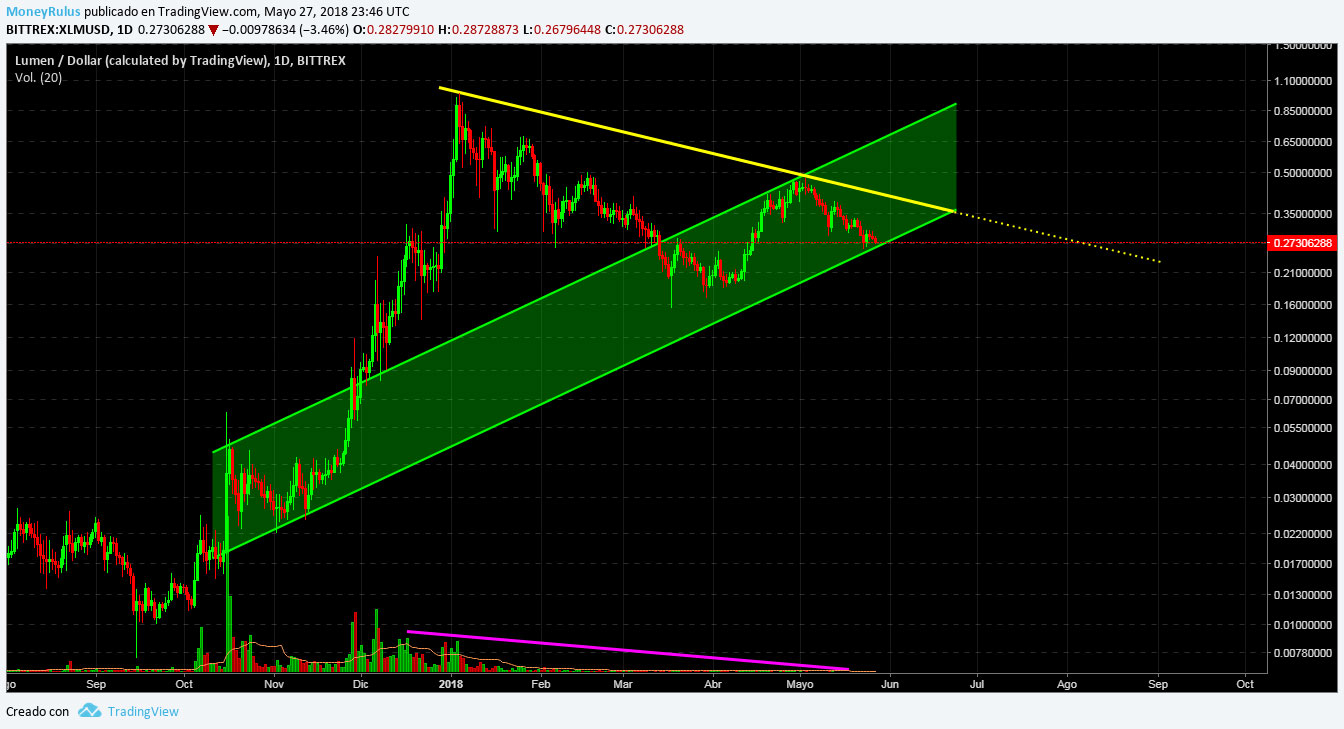
The XLM / USD pair in the Bittrex exchange house, shows an ascending channel (similar to the one already shown, but more flexible to adapt it to the fluctuations of the market), touching the lower part of the same, reason why it could bounce and go towards the top part of the channel. Besides that, there is a already seen possible symmetric triangle pattern, whose upper trend line (yellow line) acts as resistance, to reach the upper part of the channel, the price must break and validate the triangular pattern. The volume supports the aforementioned pattern (pink line), although it should be noted that since the beginning of the year, it is practically imperceptible, which leaves certain suspicions about it.
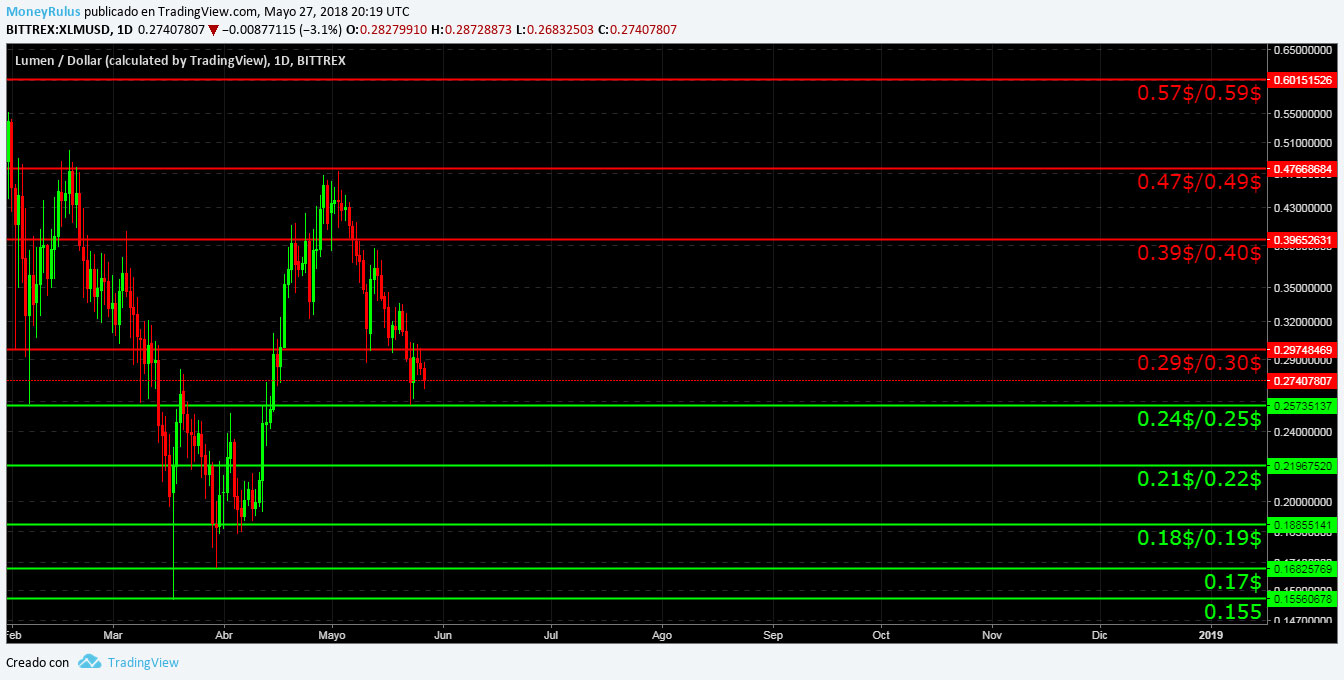
- In case of continuing the upward trend, the currency can find resistance in the areas of $ 0.29 / $ 0.30, $ 0.39 / $ 0.40 , $ 0.47 / $ 0.49 and $ 0.57 / $ 0.59 (very close to psychological levels and therefore of circumstantial significance).
- There could be supports in the areas of $ 0.24 / $ 0.25 , $ 0.18 / $ 0.19 , $ 0.17 and $ 0.15 , possible areas of value from now on.
Tron, TRX / USD
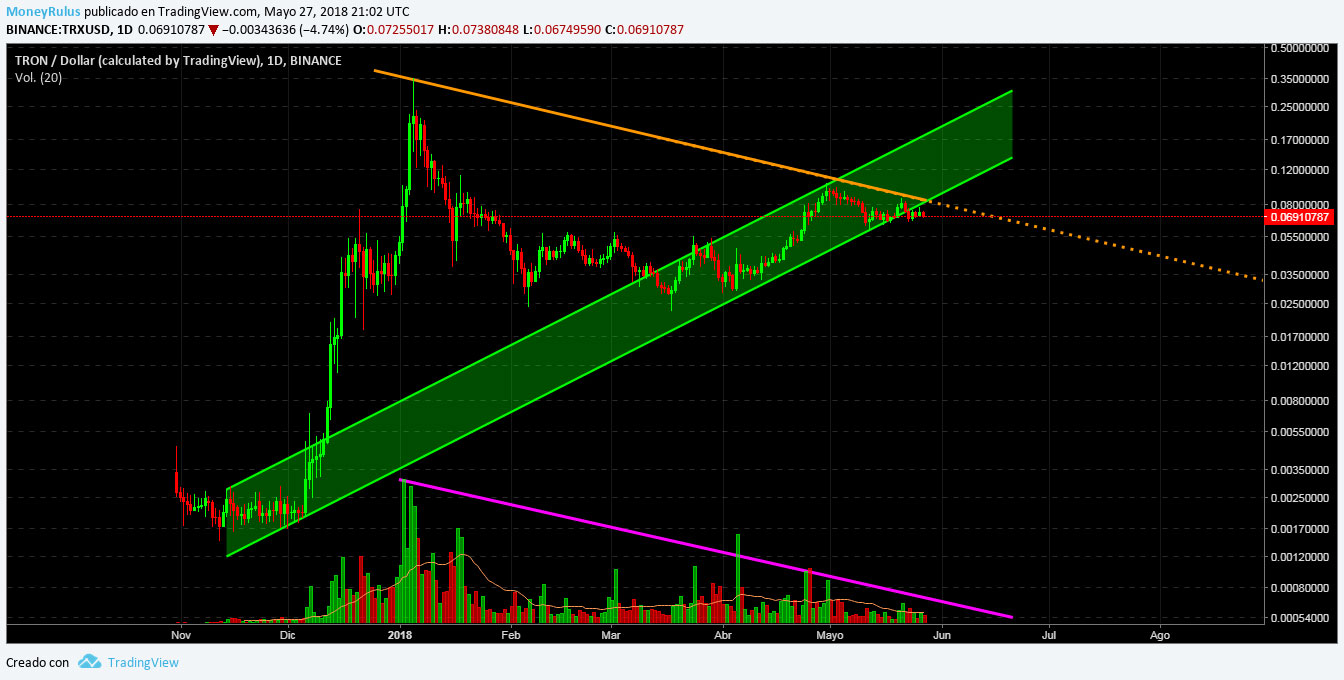
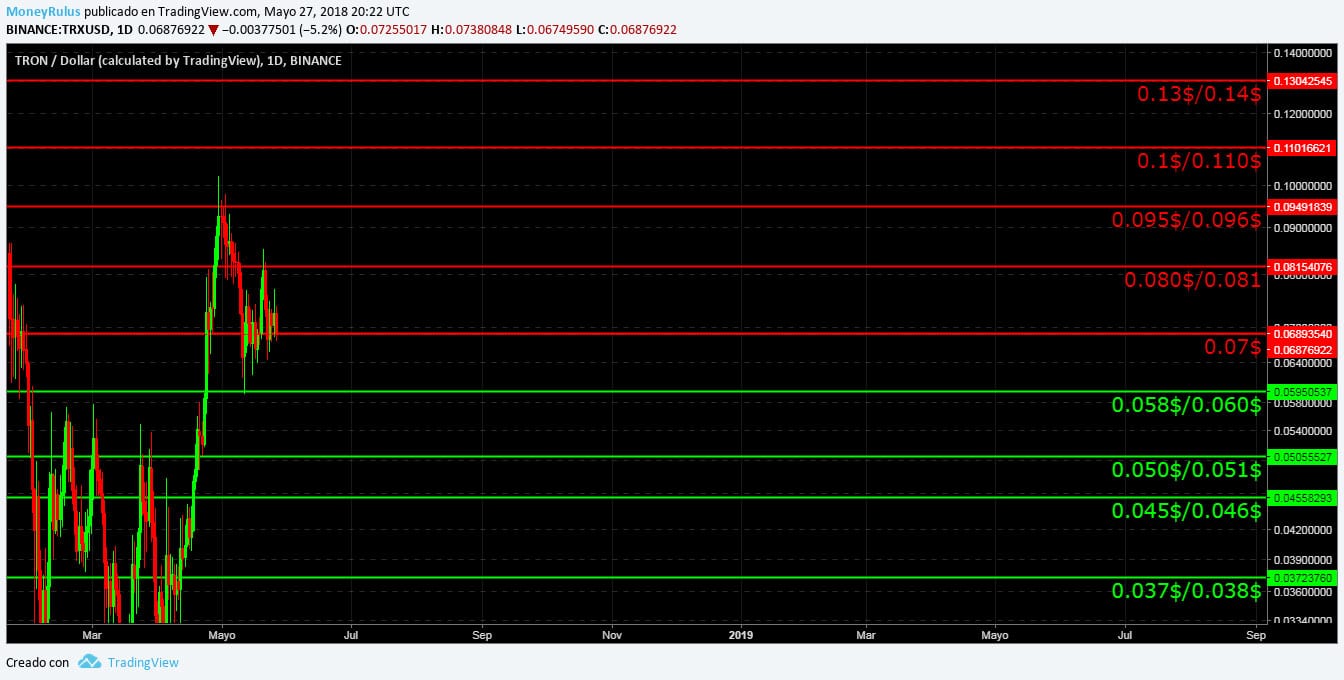
Let’s talk about the pair that displaced IOTA from the penultimate position of the ranking, TRX / USD in the Binance exchange house, shows at this moment a great symmetrical triangle pattern that we have already seen, similar to the one present in BCH, it is of great importance as we know and it is supported by the volume (pink line), which adds seriousness to the triangle. This type of continuation pattern is a purely bullish possibility, since it will continue with the trend. In addition to that, the price is within an ascending channel, close to the lower part of it, so it is possible to go to the opposite side of the channel if it bounces. At this moment it is having a puncture or in the process of a real break of the channel, to the downside. Whatever it is, it is best to be patient and wait to see what happens.
- Carrying on, in case TRX decides to raise, it can find resistance in the areas of $ 0.07, $ 0.08 / $ 0.081 , $ 0.095 / $ 0.096, $ 0.1 / $ 0.110 and $ 0.13 / $ 0.14, areas close to psychological levels that have remained intact.
- In case of continuing downwards, the price can find supports in the areas of $ 0.058 / $ 0.060 , $ 0.05 / $ 0.051 , $ 0.045 / $ 0.046 and $ 0.037 / $ 0.038 , supports also close to vital figures from here and above. The area of 0.07 $ has not been redefined as support or resistance in a clear way, for the time being, so depending on whether the price falls on it or below it, its role will change as necessary.
IOTA, MIOTA / USD
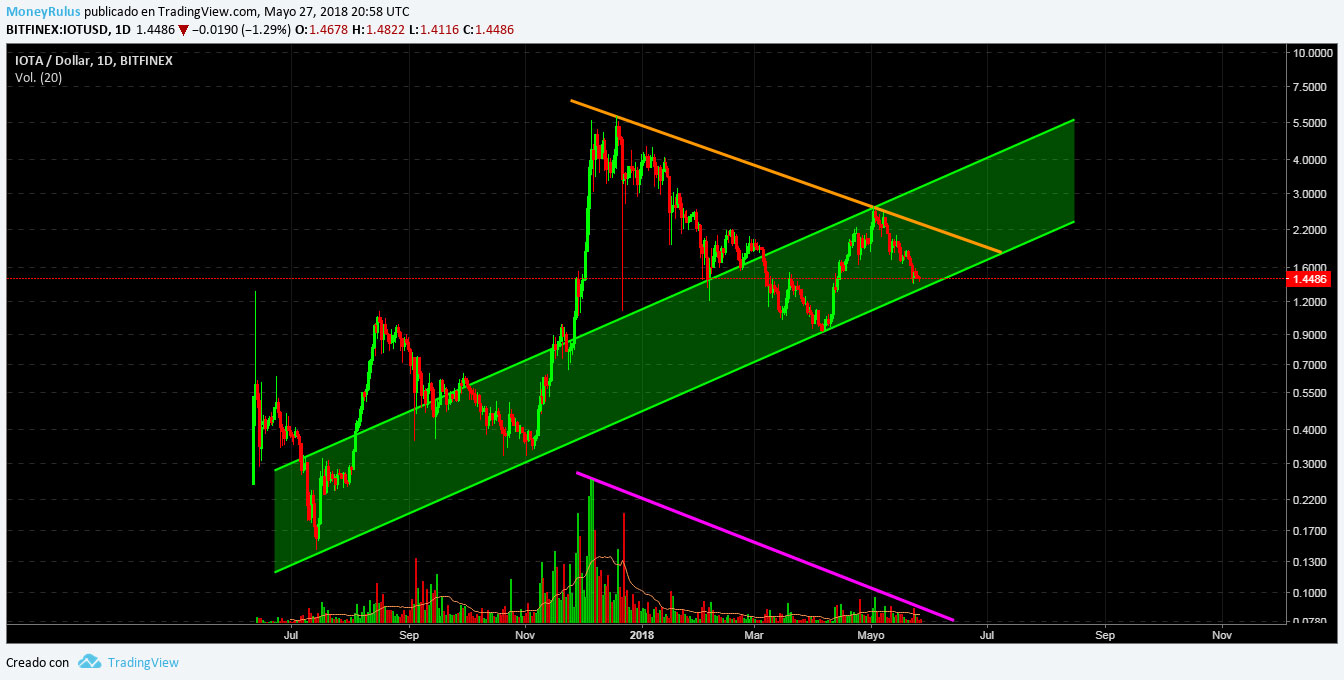
At last, let’s talk about the MIOTA / USD pair in the BitFinex exchange house, which after having been shifted down by TRX, shows that the price is within an ascending channel (similar to the one already seen, but a bit adapted) , near the bottom part of it, so if a rebound occurs it could go to the upper part of the channel. In addition to that, it shows the symmetrical triangle pattern already seen. tTis pattern is supported by the volume (pink line), so it has some security, in addition to showing a possible path to the upside in the future, continuing with the trend in course.
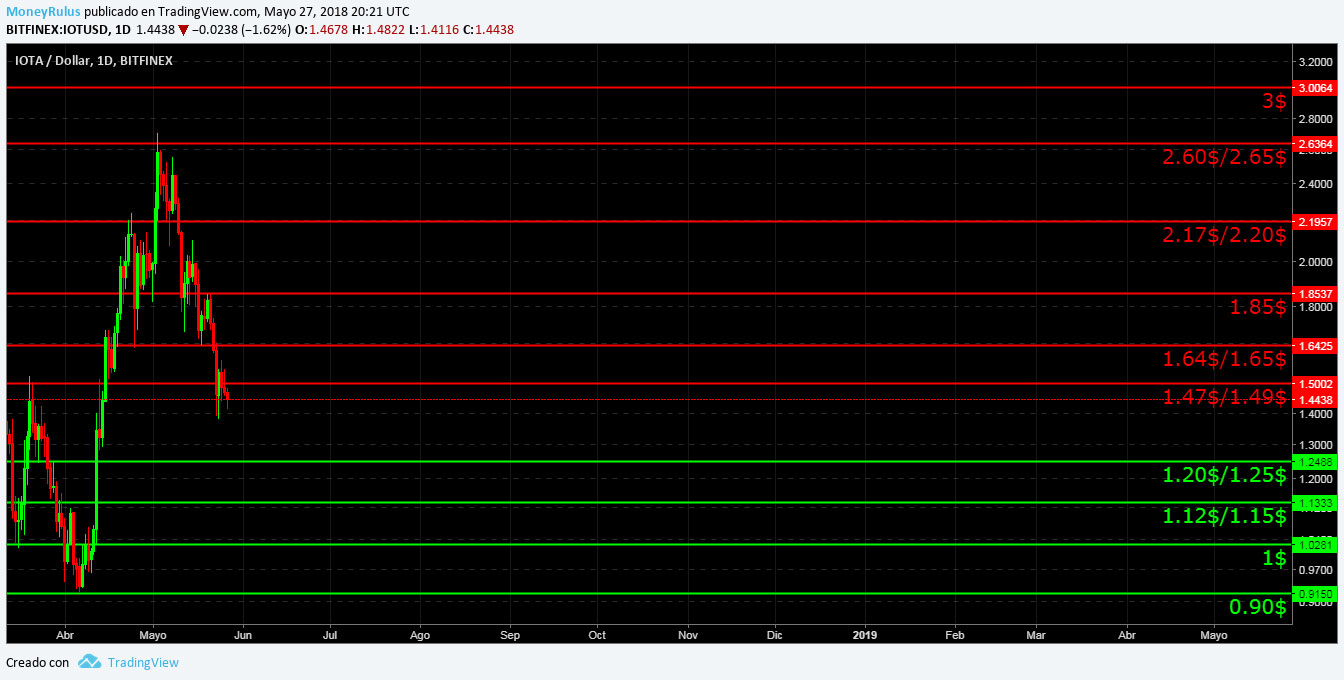
- If the market decides to move up, the price can find resistance in the area of $ 1.47 / $ 1.49, $ 1.64 / $ 1.65, $ 1.85, $ 2.17 / $ 2.20, $ 2.60 / $ 2.65 and $ 3. Resistances that have been a bit updated, but that nevertheless remains intact.
- It can also present supports in the areas of $ 1.20 / $ 1.25, $ 1.12 / $ 1.15, $ 1 and $ 0.9. Important areas, for the future of this currency, since they are strong psychological levels.


