


The pullback of Bitcoin from levels near $80,700 reached on August 25 to the zone of $76,500 has reactivated in the trading community a chart pattern not discussed with this intensity for at least three years. The so-called ‘Bart Simpson’ formation—characterized by an abrupt bullish spike, a lateral consolidation phase in the high zone, and a reversal that erases a substantial portion of the prior movement—has been highlighted by analysts such as Benjamin Cowen on his X account on September 1, reigniting the debate on whether Bitcoin is heading toward a deeper correction.
The relevance of this discussion does not reside in the graphic nickname, but in the confluence of technical signals, on-chain data, and macroeconomic variables converging at the current moment. The purpose of this article is to critically examine the elements supporting the bearish thesis, contrast them with the available empirical evidence, and evaluate whether the formation constitutes an operational warning signal or an artifact of the structural volatility of the market.
The move that shaped the pattern began on August 19, when Bitcoin traded at $64,420. Over a six-day period, the price rose to $80,700, driven by a short squeeze that elevated the quotation by approximately 25%. After reaching that ceiling, the asset entered a lateral consolidation phase in a narrow range, before initiating the retracement that has brought it to operate in the $76,500 zone.

From the perspective of technical analysis, the validation of the bearish pattern requires the loss of a critical support level: $75,800. A breakdown below this reference would confirm the structure and imply, according to the criteria established by Mati Greenspan, founder of Quantum Economics, a correction of at least 20% from the peak, which would place the price in the environment of $64,000.
Greenspan qualifies, however, that the greater market depth and institutional participation currently make this pattern less frequent in Bitcoin price dynamics than in previous years.
The ADX (Average Directional Index) sits at 22, below the 25 threshold that traders typically use to confirm the existence of a directional trend. This reading indicates that the current movement resembles a stall more than a strong downtrend.
The 50-period exponential moving average remains above the 200-period moving average, suggesting that the overall market structure has not completed a full transition into bearish territory.
The distributive factor: on-chain data and holder behavior
Beyond chart morphology, the element lending weight to the bearish thesis comes from on-chain data. Between August 18 and August 28, the 30-day accumulated distribution by long-term holders (LTH) experienced an increase of 61.5%, moving from 174,500 BTC to 281,900 BTC. This figure represents the highest level since the beginning of 2026.
Analyst Axel Adler Jr. from CryptoQuant has pointed out that the post-short-squeeze rebound improved the profitability of LTHs and opened a window for profit-taking. This behavior is consistent with the interpretation of Frank Hepworth, CEO of New Market Trading, who describes the current configuration as a classic distribution pattern, in which large holders sell into retail demand.
Spot demand has shown negative readings on consecutive days during the consolidation phase. Analyst CW8900 has noted that, without the support of spot demand, no solid foundation exists for an upward rally. In contrast, futures demand has remained firm during the same period, suggesting a migration of trading activity toward the derivatives market.
This differential between spot demand and futures demand is relevant because it indicates that speculative interest is compensating for the absence of organic accumulation. A market structure in which futures lead the activity tends to be more volatile and susceptible to cascading liquidations, especially in a context of elevated leverage.
the Fed as an adjustment variable
The Federal Reserve will meet on September 15 and 16, and markets are pricing in a probability between 64% and 68% of a 25-basis-point rate hike. This expectation has increased significantly in recent weeks, driven by statements from Fed Chairman Kevin Warsh at Jackson Hole and by persistent inflationary pressures.
The Brent oil yield above $90 and the increase in U.S. Treasury bond yields add pressure on risk assets. Bitcoin maintains a correlation of approximately 82% with the QQQ ETF, which links its behavior to that of technology stocks and, by extension, to liquidity conditions and interest rates.
Spot Bitcoin ETFs recorded on September 1 a net outflow of approximately $236 million, with BlackRock’s IBIT accounting for $201 million of that figure. This outflow reverses the $216.7 million inflow from the previous day and places ETFs in a negative flow dynamic that coincides with the weakening of spot demand.
The month of September carries a negative seasonal bias for Bitcoin. Since 2013, the price has closed with losses in 8 of the 13 Septembers, with an average decline of approximately 2.97%. The confluence of this seasonal factor with monetary tightening expectations and ETF outflows configures a macro environment that, in principle, favors the bearish thesis.
The spectrum of opinions among the analysts consulted reveals a significant divergence in the interpretation of available data.
Mati Greenspan maintains that, although the formation requires a 20% decline to complete, the greater institutional market depth could prevent a total collapse. His skepticism is based on the structural evolution of the market, which has incorporated actors with longer investment horizons and a lower propensity to react to short-term patterns.
Frank Hepworth adopts a more bearish stance, identifying the repeated rejection of Bitcoin at the 50-week moving average—located near $81,000—as the key warning signal. Hepworth projects a scenario in which Bitcoin could retrace toward $70,000, or even $58,000 if selling pressure intensifies.
The analysis from KuCoin introduces an additional perspective: the sharp decline pattern has not been confirmed, and Bitcoin appears to be in a consolidation phase at high levels rather than an imminent crash. For a genuine flash crash to occur, a clear breakdown below $75,800 and a cascade of leveraged position liquidations would be required, which has not yet materialized.
From the perspective of risk management, the current configuration demands a probabilistic assessment of possible scenarios, not a dogmatic adherence to a single chartist interpretation.
The $75,800 level functions as the technical boundary that separates the validity of the bearish pattern from its invalidation. A sustained position above this reference would allow buyers to regain momentum and potentially re-test the May high near $83,000.
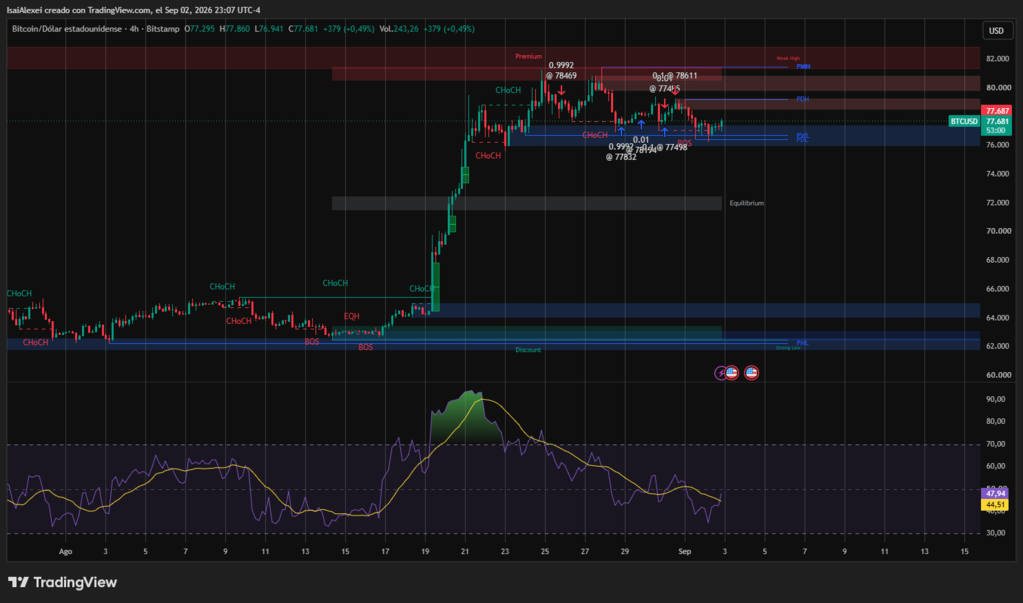
A confirmed breakdown below, accompanied by an increase in volume and the liquidation of long positions, would open the path toward $70,000 and, in a scenario of sustained selling pressure, toward $58,000.
The 61.5% increase in LTH distribution constitutes a supply-side data point that market participants must incorporate into their valuation models. The capacity of demand to absorb this supply will largely determine the direction of price in the coming weeks. The weakness of spot demand and the ETF outflows suggest that, at least in the short term, the supply-demand balance has tilted toward the seller side.
The Fed decision on September 16 and the employment data to be released in the preceding days will act as volatility catalysts. A rising rate environment tends to compress valuation multiples of risk assets, which could exacerbate any corrective movement.
The ‘Bart Simpson’ formation in Bitcoin should not be interpreted as a self-fulfilling prophecy, but as a warning signal that emerges in a context of confluence of bearish factors. The technical structure, the on-chain data of distribution by LTHs, the weakness of spot demand, and the expectations of monetary tightening configure a scenario in which the risk of correction is significant.
However, the evolution of the market since this pattern was first identified in 2015—when Bitcoin traded at $229—introduces an element that should not be underestimated. The greater market depth, the institutional participation, and the maturity of the derivatives ecosystem have modified price dynamics, reducing the probability that short-term chart patterns translate into catastrophic moves.


