Ripple prices are in a range at the time of writing. Down three percent week-to-date, the path of least resistance remains southwards. Sellers are in the driving seat as per candlestick arrangements in the daily chart.
Nonetheless, XRP bulls have a chance from an Effort versus Results perspective.
Notably, despite sellers pressing lower, prices are still ranging inside the September 22 bull bar—an indicator of strength and resistance to lower lows.
Ripple Partners with the Royal Monetary Authority of Bhutan
Behind this might be supportive fundamental events like the expansion of Ripple’s services across South East Asia–where already the company has struck beneficial partnerships with SBI, among others.
Last week, the company said it has a partnership with the Royal Monetary Authority of Bhutan to trial a CBDC project for digital Ngultrum.
In this arrangement, Ripple will integrate the XRPL into the central bank’s existing digital payment systems via their CBDC Private Ledger product. The aim is to promote financial inclusion to most of its citizens.
Specifically, during the trials, Ripple’s solutions are being trialed for cross-border payments and wholesale batch payments. The goal is to prove whether the integration of Ripple into their payment rails is efficient and sustainable in ensuring a smooth flow of funds.
Over the long haul, Ripple plans to ensure their CBDC solution is interoperable with other systems to avoid silos and roadblocks in creating the internet of value.
As results show, the absence of interoperable systems only increases costs—an antithesis of what crypto and the internet of value stand for.
Ripple Price Analysis
XRP is down three percent week-to-date versus the greenback at the time of writing.
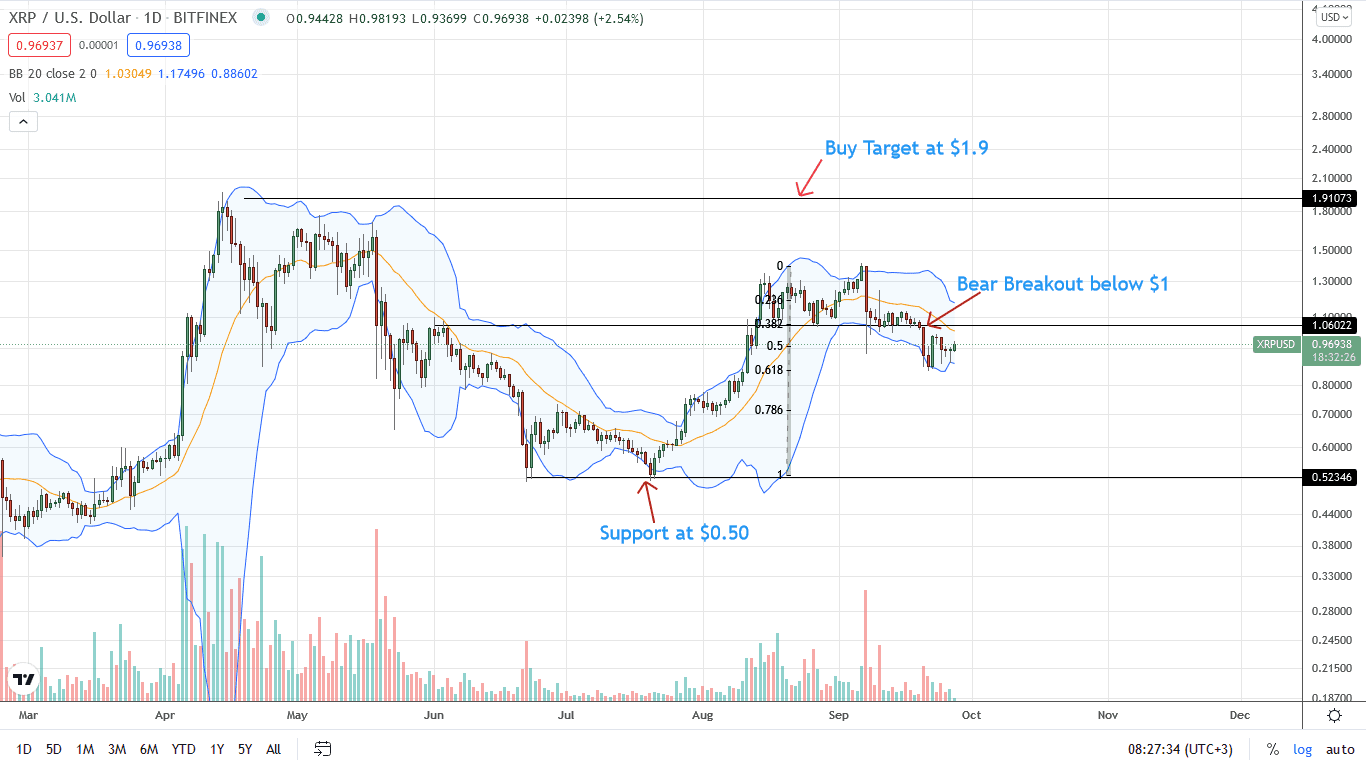
While Ripple is trading within a bearish breakout pattern as per the candlestick arrangement in the daily chart, XRP prices are resilient, adding five percent in the previous trading day.
After days of lower lows, the coin is within September 22 bull bar in a wider bear breakout pattern. Regardless, this indicates strength in the immediate term and odds of XRP springing back to $1.
On the other hand, losses below $0.84—September 2021 highs—may see XRP drop towards $0.70.
Reading from the Ripple candlestick arrangement in the daily chart, bears have the upper hand, trading in a bear breakout below the middle BB, and signaling overall weakness.
Technical charts courtesy of Trading View
Disclaimer: Opinions expressed are not investment advice. Do your research.
If you found this article interesting, here you can find more Ripple news


