

DogecoinNews
Dogecoin Flashes TD Reversal Signal at $0.14 After Buy Trigger
Dogecoin shows signs of a rebound after consolidating near the $0.14 support, with buyers defending the $0.13–$0.14 zone.


Key points
- Dogecoin shows signs of a rebound after consolidating near the $0.14 support, with buyers defending the $0.13–$0.14 zone.
- If it maintains its support, immediate resistance levels are at $0.155 and $0.17, confirming the TD bullish signal.
- The mini-cycle structure points to a potential target between $0.70 and $0.75, while the TDOG ETF moves closer to regulatory approval.
Dogecoin shows signals of a possible rebound after a week of moderate declines and consolidation near key support levels.
Day open
$0.1517
00:00 UTC
Past 7 days
−2.0%
from $0.1547
Since the open
−60.9%
$0.0593 · 16 Nov, 20:45 UTC
All-time high
−79.3%
$0.7316 · May 2021
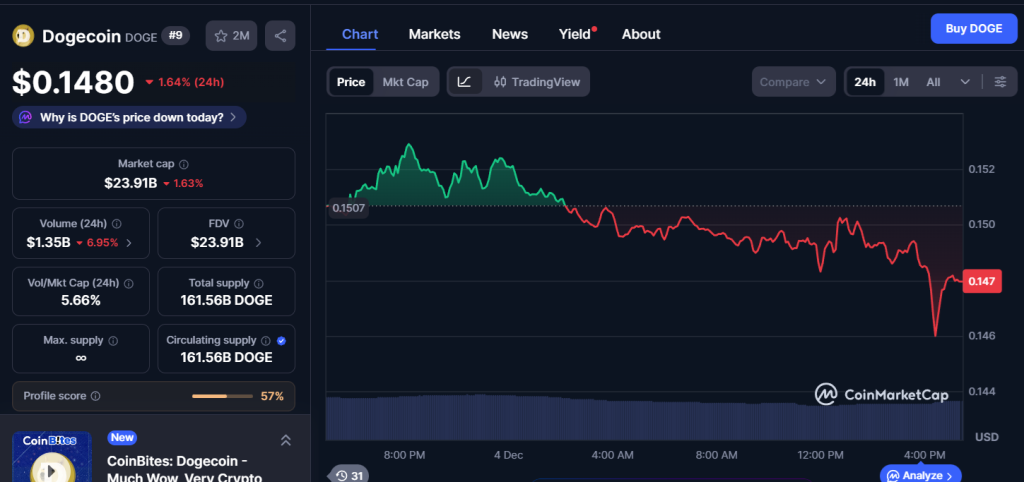
The cryptocurrency fell 1.6%, trading around $0.148 after reaching an intraday high near $0.153 before pulling back and stabilizing. Over the past week, DOGE dropped 2.3%, and over the last two weeks, it accumulated a 4.6% loss, reflecting underperformance compared with the broader market and creating mixed sentiment among traders.
Technical Analysis of Dogecoin
The weekly chart of Dogecoin shows that the TD Sequential indicator is giving a buy signal near $0.14, marked by a green “13” under the most recent candle. This signal suggests that selling pressure may be easing and that sellers are losing strength. Weekly candles show long lower wicks, indicating that buyers have consistently defended the $0.13–$0.14 area, establishing a solid support level that could serve as the base for a rebound.
If DOGE manages to maintain support above $0.14, immediate resistance levels are at $0.155 and $0.17, where previous weekly structures had stalled. A sustained move above these points would confirm the TD bullish signal and could pave the way for a deeper recovery in the coming weeks.
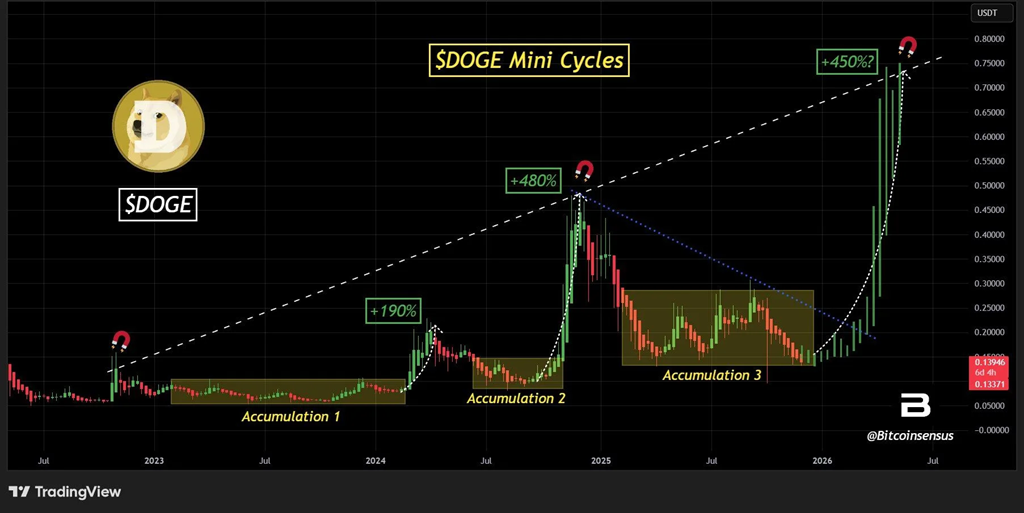
Dogecoin’s historical mini-cycle structure indicates that each accumulation phase is followed by an exponential rise. The previous two cycles produced breakouts of approximately 190% and 480%, and the current phase, called Accumulation 3, appears to be replicating this pattern, suggesting significant upside potential.
The trendline connecting previous weekly highs points to a potential target between $0.70 and $0.75, a range that could align with a macro cycle and act as the next decision point for the price. This level represents an area where the market could encounter resistance before determining the direction of the next cycle phase.
Institutional factors may also influence Dogecoin’s dynamics, as 21Shares updated its TDOG ETF filing, confirming a 0.50% fee and the involvement of key partners, bringing the fund closer to SEC approval and a Nasdaq listing
Notice. For information only; not investment advice.


