- XRP is currently trading at $2.58, registering a 3.56% increase over the past week.
- In technical analysis, the RSI rebounded from 30, indicating a possible recovery, while the MACD shows a positive divergence, signaling a potential bullish move.
- Additionally, the SEC acknowledged an ETF application for XRP, boosting market optimism.
The SEC and Its Impact on XRP’s Future
Recently, the U.S. Securities and Exchange Commission (SEC) acknowledged an application submitted by the New York Stock Exchange to list an exchange-traded fund (ETF) that would track XRP’s price. Although this recognition does not equate to approval, it has generated optimism among investors. A potential approval of an XRP ETF would allow institutional investors to access XRP in a regulated manner, potentially increasing demand and, consequently, the token’s price. Estimates suggest an XRP ETF could inject between $4 billion and $8 billion into the market in its first year.
Additionally, the re-election of President Donald Trump has influenced the cryptocurrency market. During his campaign, Trump promised to establish a strategic Bitcoin reserve, creating expectations of a more favorable stance towards cryptocurrencies. While this promise has yet to materialize, the perception of a pro-crypto administration has contributed to the recent performance of altcoins like XRP. This is likely the main reason XRP has gained over 120% in the last 90 days, and it may just be the beginning.
XRP Technical Analysis
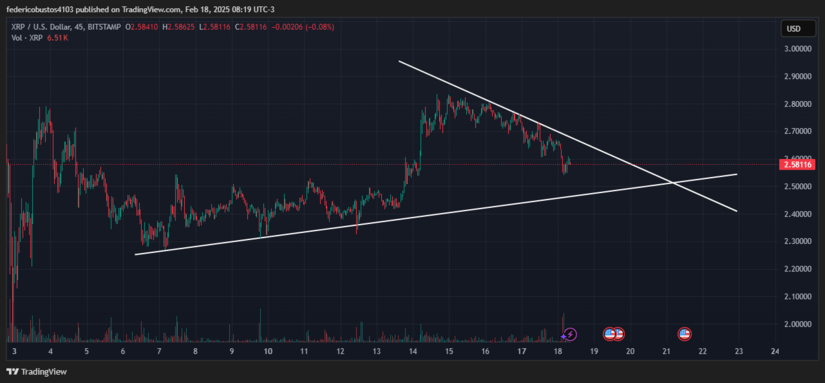
On the 45-minute timeframe chart, XRP is currently within a symmetrical triangle, trading around $2.58. This pattern suggests that once one side of the triangle is broken, the price could move in either direction, deepening or reversing the pullback that began on February 14.
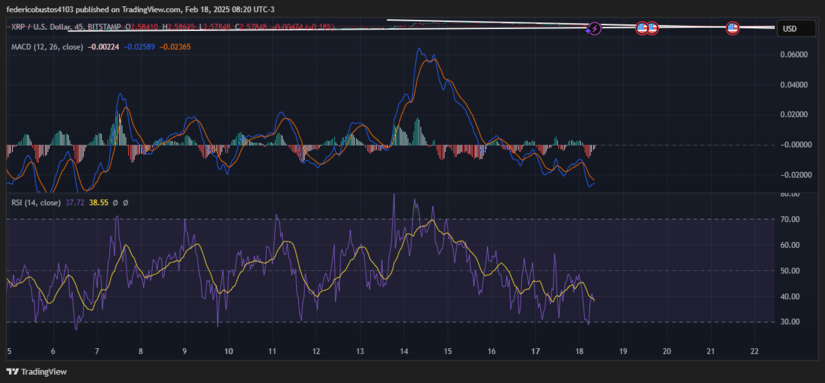
The technical analysis of XRP reveals signals that may indicate a shift in the recent trend. The Relative Strength Index (RSI) hit 30 points, a level typically considered oversold, before bouncing back. This rebound from oversold levels suggests that selling pressure may be weakening and that buyers are regaining control.
The MACD indicator shows a bullish divergence, with the MACD line (orange) potentially crossing above the signal line (blue) soon. This setup is often interpreted as a sign of a possible upward trend reversal. Additionally, the recent increase in trading volume supports this perspective, as rising volume during bullish movements indicates renewed investor interest.
In summary, both technical indicators and recent fundamental developments point toward a possible end to the pullback and the beginning of a recovery in XRP’s price. If this scenario unfolds and the triangle breaks upward, Ripple’s token could target $2.83 in the short term.
The key will be monitoring buying strength in the coming hours and evaluating whether volume supports a new bullish attempt.
Technical charts courtesy of TradingView.
Disclaimer: The opinions expressed do not constitute investment advice.If you are looking to make a purchase or investment, we recommend that you always do your research.
If you found this article interesting, here you can find more XRP News.