TL;DR
- U.S. liquidity shocks impact Bitcoin as a risk asset, contradicting its safe-haven narrative.
- On-chain data shows institutional distribution versus retail accumulation, a pattern preceding major declines.
- Critical support levels are $68,000 and $62,000, with high systemic risk from DeFi leverage.
Wall Street opened without clear direction as tech stocks faced renewed pressure. The real story lay in sector rotation rather than widespread weakness. The Nasdaq dropped 1.51%, dragged lower by software companies reacting to Anthropic’s new artificial intelligence automation tools, which reignited fears about faster disruption in traditional SaaS business models.
Since October peaks, the software group has shed over 25%. AMD led the pain, plunging 16% intraday, posting its worst single-day decline since 2018, after AI revenue guidance missed optimistic expectations. The Dow Jones, by contrast, rose 0.53%, and most S&P 500 components closed higher. This divergence signals money rotating out of crowded tech positions rather than a broad market retreat.
Gold traded below $5,000 per ounce during this session, pulling back after January’s sharp rally. Despite maintaining year-to-date gains exceeding 10%, profit-taking emerged as the dollar strengthened. Volatility remains elevated following late-January declines.
Bitcoin’s Story Reveals Deep Historical Risk Patterns
John Roque from 22V Research examines long cycles, not hope. He says Bitcoin has gone through five major bear markets since 2011. The average drawdown across those cycles hit approximately 80%. The smallest decline still wiped out 72% of value. If the current cycle hits that smaller level, price would fall around $35,200. For now, John keeps a nearer level in view at $60,000, but only while that line holds.
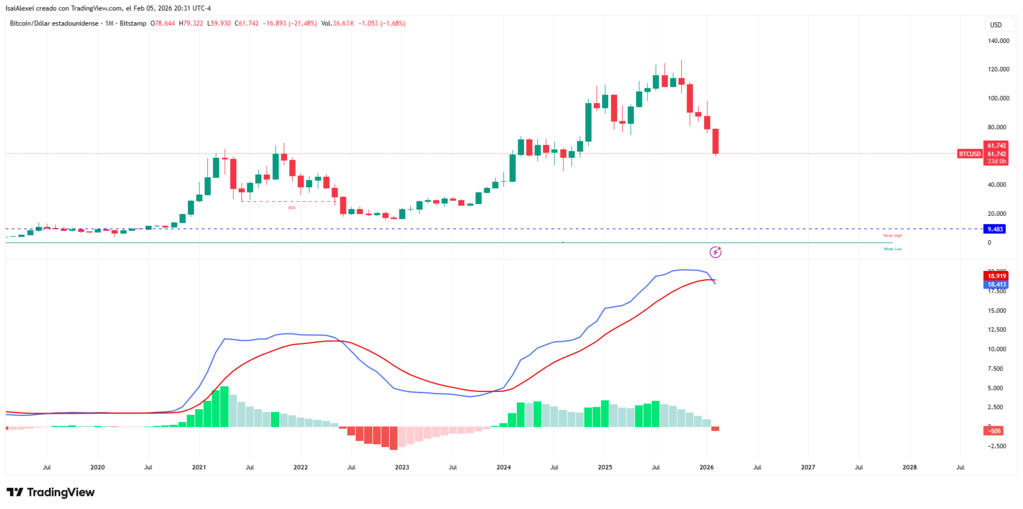
Michael Purves of Tallbacken Capital sees danger from longer signals. He flagged a monthly MACD crossover that triggered in November. He said the signal has an excellent track record for warning of large drops. The last four times it appeared, losses reached 60% to 65%. Michael also pointed to $76,000, which matches the average cost basis of Michael Saylor’s strategy, the largest corporate holder of the asset. That price already failed.
On Polymarket, odds for a finish below $55,000 climbed to roughly 60%. Odds for a rebound to $100,000 fell to 54%, down from 80% at the start of the year. Short-dated bets lean even darker. One February market now prices a 72% chance Bitcoin trades below $70,000 by March 1. That jump rose more than 35 percentage points this month, backed by approximately $1.7 million in bets.
Bitcoin Disconnection Myth and Institutional Reality
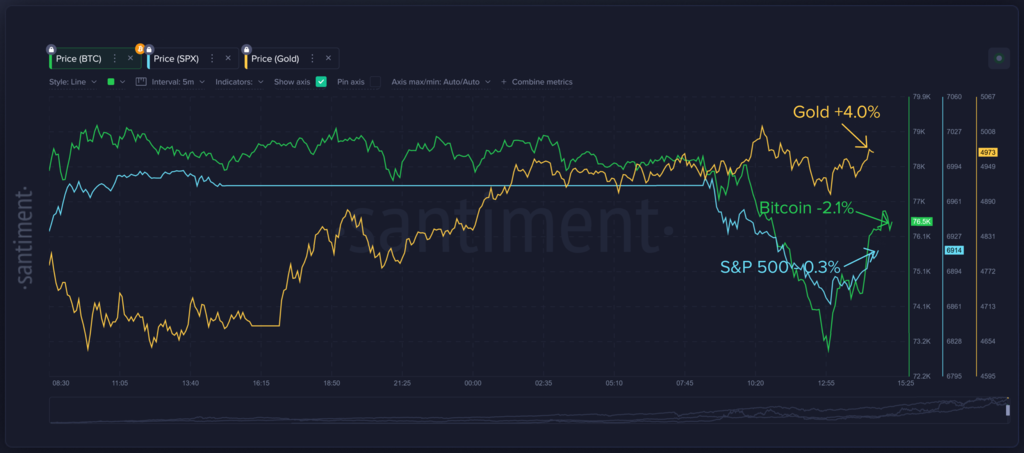
Something many veteran traders already intuited gets confirmed: despite its decentralized narrative, Bitcoin remains anchored to the liquidity cycle of the U.S. dollar. When Congress debated government shutdown, BTC fell to $72,800 with $30 million in DeFi liquidations. What proved revealing was perfect synchronization with the S&P 500 and even gold. This is not casual correlation; it is evidence of deeper realities.

Institutional whales, especially spot-style exchange-traded funds, operate within U.S. regulatory and political horizons. Global “risk-off” activates cross-asset liquidation algorithms that do not discriminate between “traditional” assets and cryptocurrencies. While the dollar remains global reserve currency, any U.S. liquidity shock transmits to Bitcoin as a risk asset, not a safe haven.
Current on-chain divergence shows real concern. 50,181 BTC sold by wallets holding 10 to 10,000 BTC (institutional and early participants) versus accelerated retail accumulation over recent weeks. Large holders exit while retail buys. In 2017 and 2021, this pattern preceded declines of 60% to 80%. Today false security persists while markets remain in “risk-on” mode.
ETF flows no longer help. Tens of billions flowed into funds last year and lifted prices. That support faded. U.S.-listed crypto ETFs saw nearly $4 billion in outflows over the past three months, based on Bloomberg data. Research from Glassnode and K33 shows the average trader now sits underwater financially.
When retail accumulates while institutions distribute, structural correction precedes technical recovery. Critical levels sit at $68,000 as psychological support and $62,000 as historical on-chain demand zone. In high macro-correlation environments, reduce DeFi leverage. Liquidations of $30 million show fragility in the lending layer. A political flash crash could amplify exponentially through interconnected systems.