![Tron [TRX] Price analysis TRX / USD, November 13](https://crypto-economy.com//wp-content/uploads/2019/07/analisis-tron.jpg)
The past 24 hours (12 November, 14:30 pm -13 November, 14:30 pm) have been part of a prolonged downtrend since 7th November, currently oscillating between 0.02260 and 0.02270. The price of Tron has gone through a 24 hour change of 0.00005, going through a 24 hour high of 0.002299 and a 24 hour low of 0.02250. The current 24 hr. trading volume is set at 5.5 million USD.
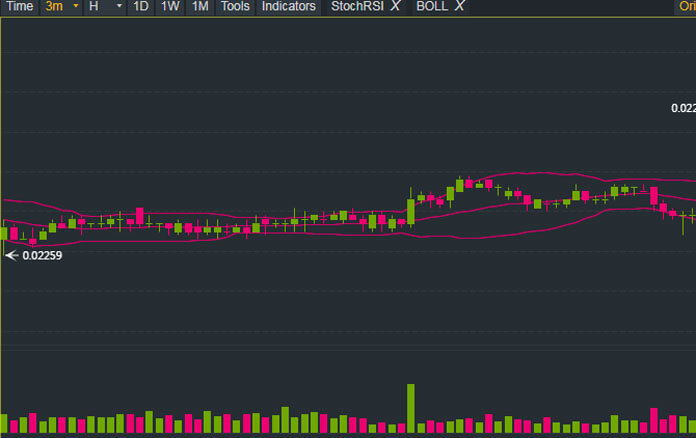
On 12 November, 14:30, the price broke out from 0.02271 on a bullish rally to reach the 24 hour high at 0.02299 in 4 hrs. Upon reaching the 24 hour High it went bearish in about 10 hours to strike the 24 hour low. From then onwards it corrected 0.02280 where it has been oscillating in the current range (0.02260-02270).
Indicators: Bollinger, RSI, MACD and Stochastic
-
Bollinger Bands
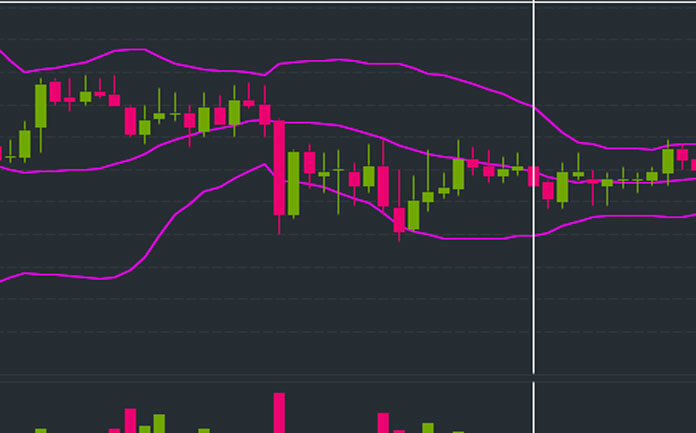
Since the 24hour high, the Bollinger bands have been narrowing to end up in the current Bollinger squeeze that has been sustained since 10:30 am. The trend indicates a general downward trend over the 24 hour period with imminent reversal considering the classic Bollinger squeeze which usually precedes a period before increased volatility.
-
RSI
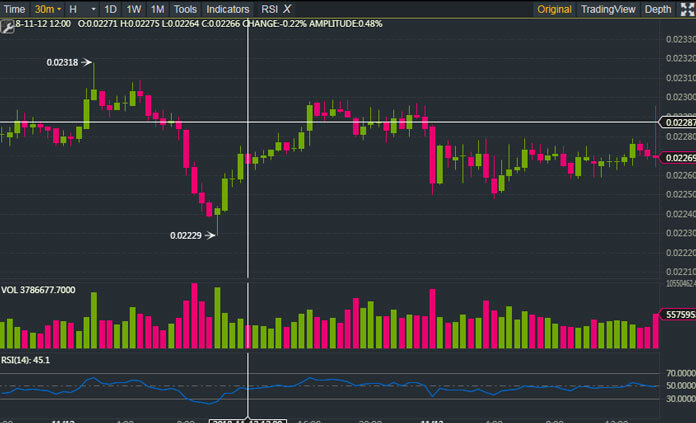
The downward trend has demonstrated two major oversold conditions in the past 24 hours, one at 12 am and another at 4:00 am. The only notable overbought condition was seen during the 24 hour high on 12 November at around 4 pm. currently, the RSI line lingers around 50 after a progression from the previous oversold zone.
-
MACD
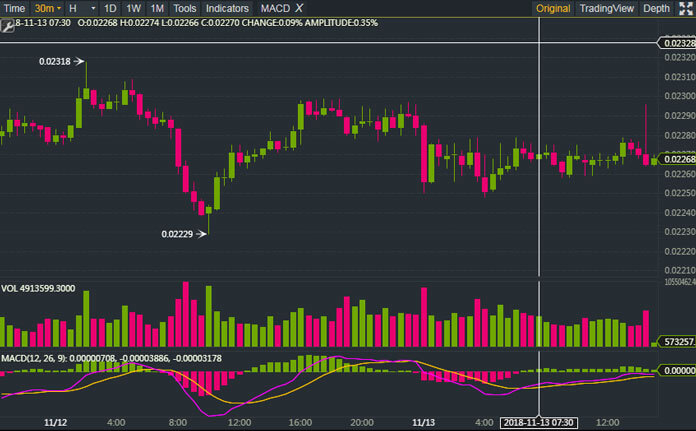
Currently, there is an indication of a bullish trend as we are coming from a previous bearish crossover at 6:30 in the morning. Another bearish crossover occurred at the onset of the downtrend following the 24 hour high at around 9:30 pm. The trend is consistent with the Bollinger bands which is indicative of an imminent bullish rally.
-
Stochastic indicator
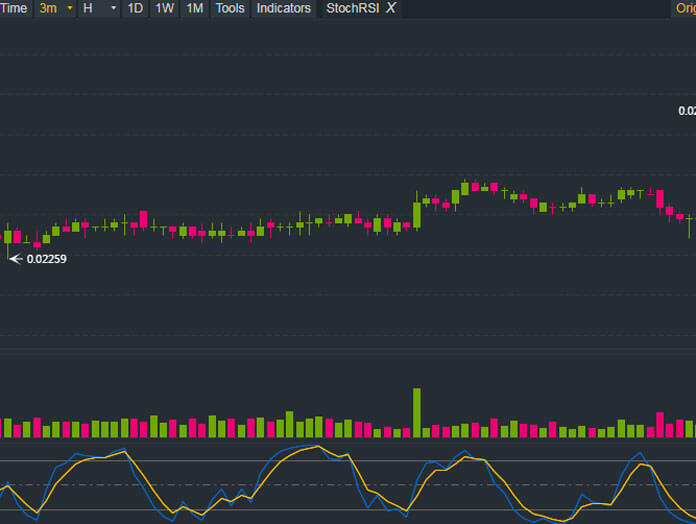
The stochastic indicator provides a relatively identical piece of data to the Relative Strength Index. Currently, the graph is within the middle range at 50 with two major oversold conditions at roughly the same times as indicated by the RSI.
The past 1 hour
The graph has rather followed a symmetrical pattern oscillating between 0.02280 and 0.02268. The stochastic indicator and Relative strength index are showing an oversold zone thus predicting a short term bullish rally. This is also substantiated by the Bollinger squeeze which indicates an imminent change of volatility.
Short term-wise, all the major indicators are pointing towards a short term upward trend which is part of a symmetrical trend which has been taking place the past 2-3 hours.
Conclusion
The past 24 hours have been part of the 6 day downtrend experienced by the cryptocurrency. However, major indicators are showing a possible reversal within the next 24 hour period.