The correlation between global M2 growth and Bitcoin price is documented in several studies and is not disputed. The sector’s use of the correlation is disputable: it is employed as a complete explanation for any price movement.
Aggregate liquidity determines how much capital is available to allocate to risk. The allocation of capital among instruments depends on other variables: valuation frameworks, market depth, and competition with other sectors for the same flow.
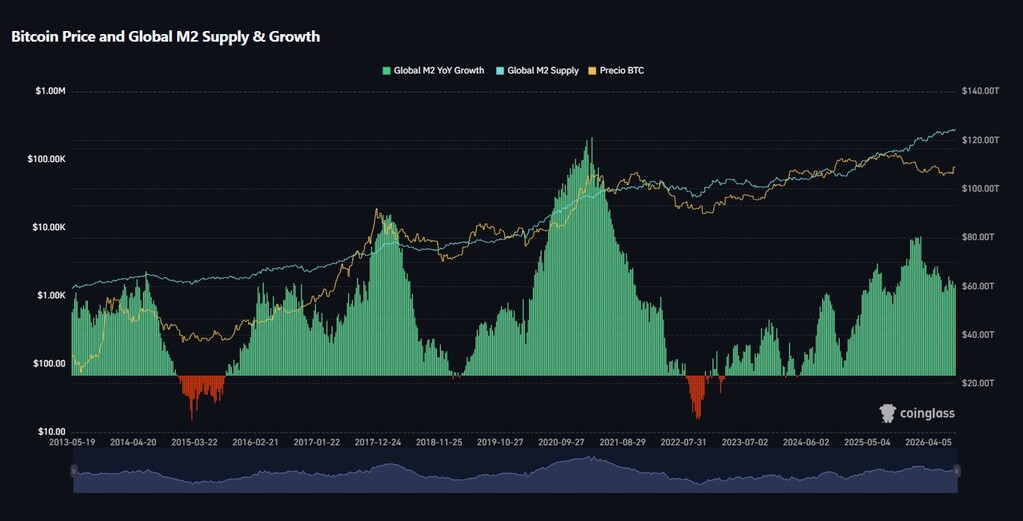
Aggregate liquidity has three layers with distinct transmission speeds. The monetary base administered by the Federal Reserve through balance sheet operations. Bank credit creation, which determines M2 and depends on loan demand and underwriting conditions.
Endogenous leverage generated by derivatives desks, basis trade funds, and collateral lenders inside the crypto market. The first two layers are exogenous to the sector. The third is internal and, over short horizons, has amplified price movements more than any variation in a central bank balance sheet.
The G10 excess liquidity indicator turned negative during 2026, according to data cited in the reference analysis. Historical records show negative readings precede weakness in risk assets with a lag of three to six months. It is an empirical regularity, not an established causal relationship. If sustained, pressure would shift to late 2026 and early 2027.
The October 2025 liquidation episode, with approximately USD 19 billion in forced position closures, remains the reference for measuring fragility. Aggregate open interest did not recover previous levels. Order book depth in most relevant pairs remains below 2024 records.
The consequence is a market with lower capacity to absorb large orders without displacing price. The deficiency operates asymmetrically: it is compensated by new flow when macro liquidity is favorable and amplifies declines when it is not.
The 30-day correlation between bitcoin and the S&P 500 fell to negative territory at the end of 2025 and stabilized at low levels during 2026. The usual reading, asset maturity, is not supported by flow data. Desk reports indicate retail flows moved from moving in the same direction in both markets to competing for the same capital. Decoupling reflects reallocation, not autonomy.
Integration of equities and crypto assets in investment platforms reduced the cost of switching markets to a few clicks, enabling direct substitution. When the retail investor finds verifiable catalysts in equities, such as the AI capex cycle, marginal allocation to crypto falls. The absence of an accepted valuation framework for most digital assets prevents construction of a thesis able to compete on equal terms.

Institutionalization concentrated liquidity instead of distributing it. OTC desk data show an institutional volume proportion above 70% in spot, with bitcoin and ethereum absorbing the majority. Altcoins register continuous reduction in depth and wider effective spreads. For a manager with exposure to smaller assets, execution cost rose.
Derivatives added a transmission channel from the traditional money market. Volatility selling and basis trade strategies generate stable income while conditions hold and concentrated losses when they break. They depend on collateral and funding rates, and respond to margin calls with traditional market risk management criteria, not with the sector narrative. The layer transmits expansion and contraction with equal efficiency.
Stablecoin issuers accumulate short-term Treasury bills in volumes exceeding holdings of several central banks outside Japan. The asymmetry between issuance and redemption is documented: redemptions pressure short-term rates with an intensity two or three times greater than the downward pressure generated by issuance. Regulatory discussion of systemic risk has more foundation in the short-term sovereign debt market than in bitcoin price volatility.
The sector can build proprietary metrics
A useful panel would include net open interest, order book depth per pair, effective spreads during low-activity hours, holding concentration per entity, and net stablecoin flows disaggregated by issuer. None anticipates prices alone.
Combined, they permit distinction between a decline originating in macro liquidity and one originating in internal structure. The distinction changes the response: the first is managed with hedging and beta reduction; the second, with position size reduction and investment horizon adjustment.
The utility of metrics is operational, not analytical. Investment committees do not reject volatility; they reject the inability to measure it with instruments recognized by their governance frameworks. Without proprietary metrics, exposure limits to crypto assets default to satellite position levels.
Three variables define the scenario for coming quarters. The trajectory of G10 excess liquidity. The nature of the AI capex cycle, which moved from disinflationary factor to possible inflationary factor through energy and infrastructure costs. The interaction between the stablecoin market and short-term rates.