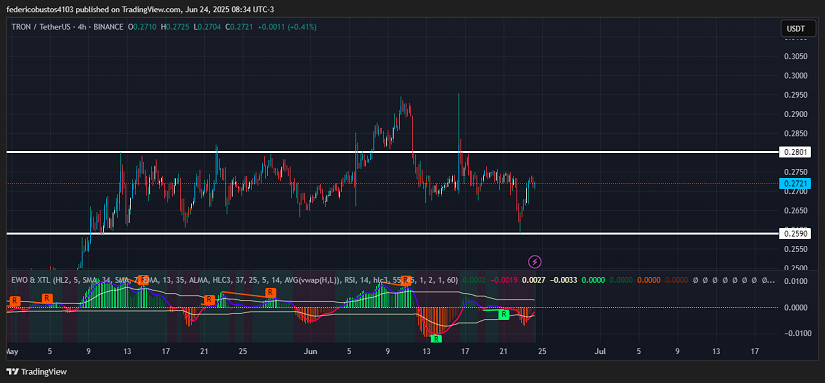
- TRX is trading within a channel between $0.2590 (support) and $0.2801 (resistance), currently priced at $0.2721 (+1.97%) after bouncing off the support level.
- Over the past two weeks, Tether issued approximately $2 billion in USDT on the Tron network, with strong adoption and over 9 million daily transactions, positioning TRX as the 8th largest cryptocurrency by market cap.
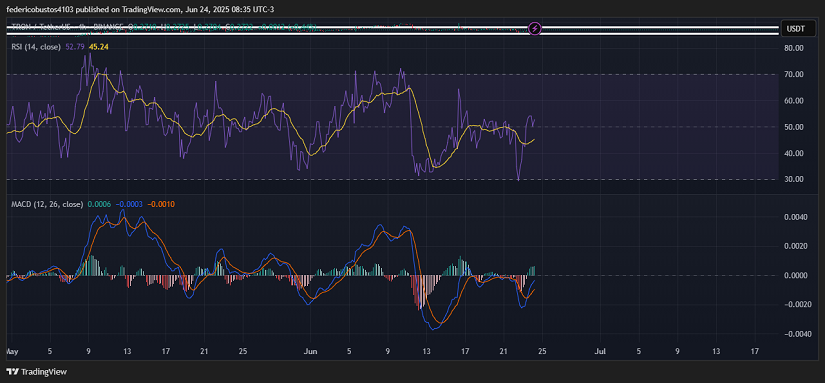
- Technical indicators (EWO, RSI, MACD) are flashing bullish signals, strengthening the case for an upward move—especially if the resistance zone is broken with volume.
Tron’s Strength Amid Geopolitical Uncertainty
In the last two weeks, Tron has reinforced its position through major developments: Tether issued around $2 billion in USDT on its network, significantly increasing on‑chain liquidity and activity, with more than 9 million daily transactions and a success rate exceeding 96%. Additionally, TRX surpassed Dogecoin in market capitalization (now 8th globally), and the reverse merger with SRM Entertainment sparked expectations of greater institutional exposure.
However, on the macro front, the recent U.S. airstrike on three nuclear facilities in Iran (Operation “Midnight Hammer,” June 22) and threats of retaliation have triggered volatility in risk markets. The crypto market dropped over 6% in 24 hours, with liquidations exceeding $1 billion.
Despite this, Tron has shown relative resilience compared to more volatile altcoins, remaining near its technical support thanks to strong adoption and real-world utility. Therefore, while geopolitical tensions pose short-term risks, Tron’s solid fundamentals—network usage and institutional momentum—offer it a better chance to weather the storm and resume its upward trend.
Technical Analysis of TRX
From a 4-hour technical perspective, TRX bounced strongly off $0.2590 after a 12% drop from a key high of $0.2953 on June 16. It’s now trading at $0.2721, near the middle of a defined channel between $0.2590 (support) and $0.2801 (resistance). The rebound was accompanied by green volume bars, indicating buyer accumulation; a sustained increase in volume will be key to confirming a bullish breakout.
The EWO histogram has not yet turned green but shows decreasing red bars, suggesting a possible reversal into bullish momentum. This setup is typical in the early stages of an impulsive wave, where polarity shift is still unfolding.

The RSI (14) climbed from oversold territory (30) to around 53, implying there’s still room to move higher without entering overbought conditions, this aligns with the EWO’s bullish setup.
The MACD (12,26) recently confirmed a bullish crossover: the MACD line (blue) moved above the signal line (orange), and the histogram flipped positive, confirming growing buyer momentum. It’s essential for MACD to maintain this structure to support the short-term trend.

Conclusion and Scenarios
Technically, the setup is clearly bullish: if TRX breaks above $0.2801 with strong volume, a rally toward $0.295–0.300 is likely. Conversely, a drop below $0.2590 would invalidate this scenario and could lead to a move toward $0.245–0.250. For now, indicators are aligning in favor of the bulls, supporting a continued upward strategy.
Technical charts courtesy of TradingView.
Disclaimer: The opinions expressed do not constitute investment advice.If you are looking to make a purchase or investment, we recommend that you always do your research.
If you found this article interesting, here you can find more TRON News.


