
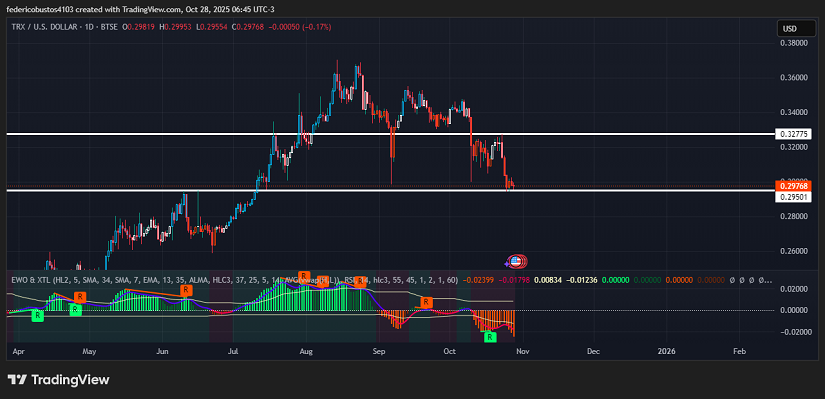
- The price of TRX is trading around $0.29768, very close to the structural support at $0.29 and within a resistance range at $0.32.
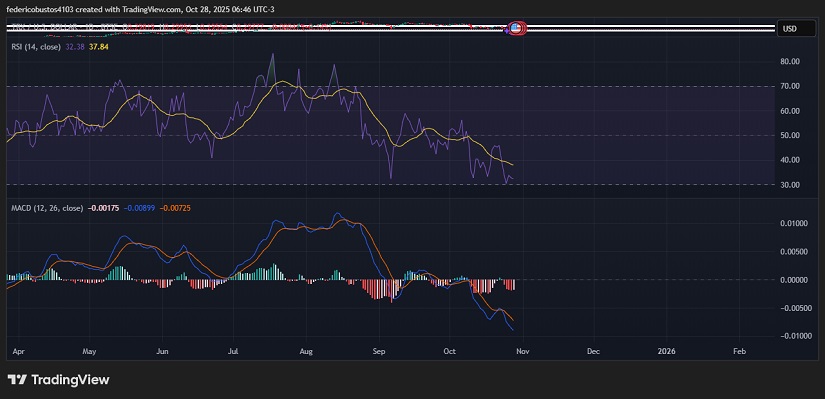
- Technical indicators show weakness: bearish momentum dominates (negative EWO, MACD without a bullish crossover) and volume does not support a possible reversal, suggesting that a trend change is not yet confirmed.
- On the fundamental side, the crypto environment is improving, but no clear and immediate catalyst has been identified for TRX that could drive strong demand; therefore, caution is recommended before anticipating a rebound.
Between Network Growth and Institutional Doubt
On the fundamental side, TRON shows clear progress in terms of adoption and utility: its ecosystem has recorded record revenues of more than $1.2 billion in Q3 2025, reflecting real expansion and growing network activity. In addition, reports indicate that the network processes nearly half of all USDT transactions worldwide, consolidating its role as stablecoin settlement infrastructure.
On the other hand, the global crypto and institutional context shows signs of prudence: the altcoin market shows a structural decline — an estimated $800 billion shortfall compared to previous cycles — highlighting that risk appetite is reduced. At the macro level, economic uncertainty in the U.S., with the federal government shutdown and suspended economic data, also adds a layer of uncertainty for institutional flows. As a result, although TRON’s technology and ecosystem are promising (creating upward pressure on structural demand), the lack of an immediate institutional catalyst and the conservative macroeconomic environment may temporarily hinder a larger injection of capital.
Technical Analysis of $TRX
From a technical perspective, TRX has seen a significant drop from the local high of $0.37 reached on August 14, to approximately $0.294 last Saturday, representing a contraction of close to 20%. This zone now acts as a key structural support, while $0.32 functions as immediate resistance.
Volume does not show a convincing rebound to support a bullish reversal: the decline has been supported by bearish pressure, but there is no strong buying participation that would indicate accumulation. This lack of volume reinforces the possibility that price has not yet defined whether it will consolidate or continue its decline. The EWO (Elliott Wave Oscillator) continues showing negative bars, reflecting that bearish momentum prevails and that no positive divergence suggesting a trend change has occurred.
The RSI (14) is at low values (32.38), indicating relative oversold conditions, but it has not yet generated a clear bullish divergence. While this may leave room for a technical rebound, the absence of a strong technical signal makes it less reliable. Finally, the MACD (12,26) keeps its histogram in negative territory and the signal line has not crossed upwards, confirming that momentum is still bearish.
Conclusion and Scenarios
Although TRX is in an “interesting” zone for a possible rebound, technical indicators show that this is not the time to anticipate the movement with certainty. It is more prudent to wait for the support to hold, an increase in volume to appear, a divergence in EWO/RSI, and a bullish crossover in MACD. Only then could a more reliable reversal scenario be considered.
Technical charts courtesy of TradingView.
Disclaimer: The opinions expressed do not constitute investment advice.If you are looking to make a purchase or investment, we recommend that you always do your research.
If you found this article interesting, here you can find more TRON News.