
- Elon Musk distances himself from Dogecoin, dismissing its official use by the Trump administration, which directly impacts the main media engine behind the memecoin.
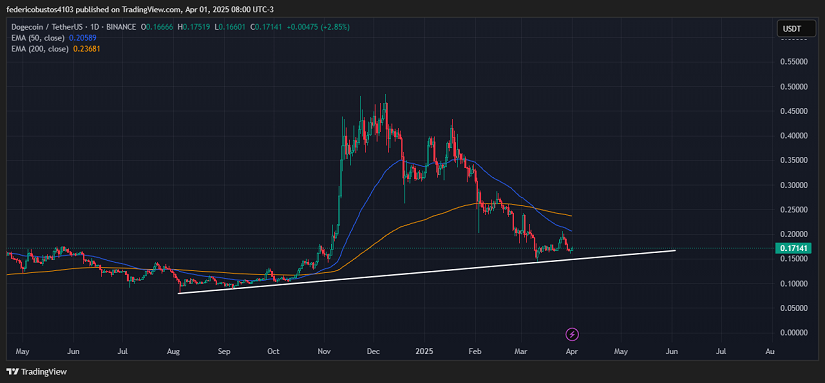
- The bearish crossover between the EMAs and weak volume suggest that buying momentum is exhausted.
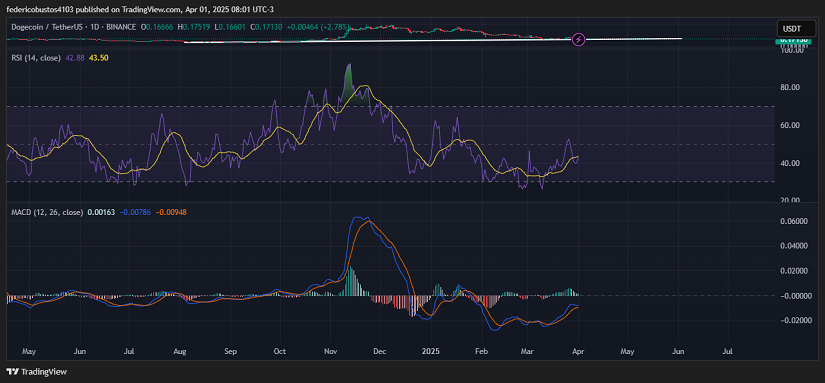
- The RSI and MACD indicators still show no signs of reversal, reinforcing the likelihood of further pullbacks towards $0.14 or lower.
Dogecoin Deflates Amid Scandals, Disappointments, and a Market Turning Its Back
While the crypto market continues to face macroeconomic uncertainties, Dogecoin ($DOGE) has failed to capitalize on the brief rallies seen in assets like Bitcoin. Despite BTC managing to reclaim the $80,000 zone, DOGE remains lagging behind. It is currently trading at $0.17141 with a 2.85% increase in the last 24 hours. The excitement that once pushed it close to $0.50 in December 2024 seems to be a thing of the past.
The first quarter of 2025 has been one to forget. In addition to the rising economic tensions triggered by former President Donald Trump’s tariff announcements, scandals have shaken investor confidence: attacks on platforms like ByBIT and Coinbase due to security flaws have sparked a wave of fear among both retail and institutional users.
As if that weren’t enough, Elon Musk recently declared that Dogecoin will not be used in any official process involving the U.S. government, causing widespread pessimism within the community that had placed hopes on eventual state adoption.
Technical Analysis of DOGE
Since hitting its last significant low at $0.14280 on March 11, DOGE has attempted unsuccessfully to establish a bullish rebound. Although there was some recovery, it has been unable to break above the 50-period exponential moving average (EMA 50), which currently acts as a key dynamic resistance. The 200-period EMA remains well above the price, highlighting that the asset is still in a clear downtrend.
Trading volume has remained weak, reinforcing the idea of a lack of interest from institutional buyers or large investors.
The Relative Strength Index (RSI) is hovering around 42 points, showing no clear signs of being oversold, but still below the 50 mark with a clear downward trend, indicating that bears remain in control.
The MACD also supports a bearish outlook. Although the MACD line (blue) has crossed above the signal line (orange), the crossover is weak. This type of movement in a low-volatility zone with barely positive histograms is often seen as an unreliable signal, suggesting consolidation rather than upward momentum.
Conclusion & Scenarios
Unless the broader market sees a major rally or Dogecoin surprises with disruptive news, the current technical outlook suggests the asset could break the ascending trendline shown on the chart and retest the $0.14 area, or even fall below it.
The lack of volume, failure to break above the EMA 50, and weak technical signals make it difficult to support a bullish case in the short term. The most likely scenario for now continues to be bearish consolidation or further corrections.
Technical charts courtesy of TradingView.
Disclaimer: The opinions expressed do not constitute investment advice. If you are looking to make a purchase or investment, we recommend that you always do your research.
If you found this article interesting, here you can find more DOGECOIN News.