
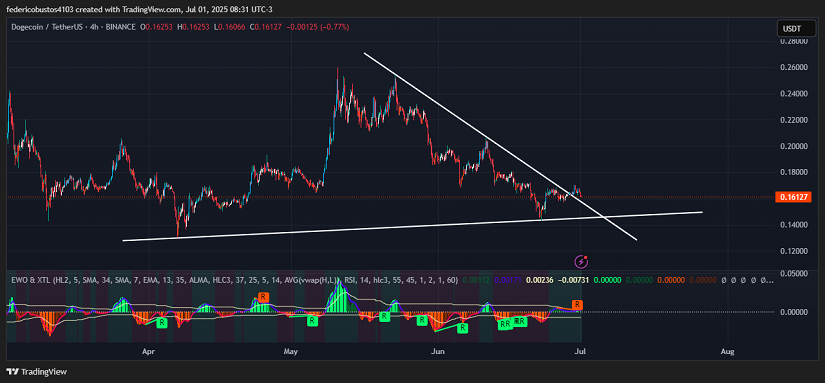
- $DOGE recently broke a descending trendline that began on May 23, potentially signaling a short-term structural shift.
- The current price is $0.16127 after rebounding 13% from the local low of $0.14270 marked on June 22.
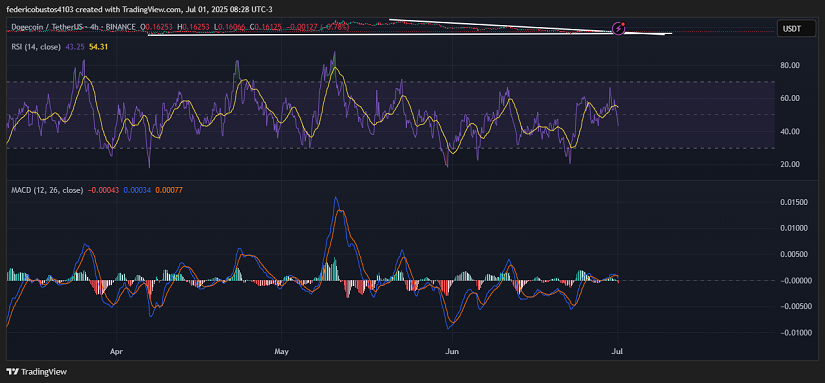
- Technical indicators like the RSI and MACD are starting to show signs of bullish exhaustion, suggesting a possible loss of momentum in the uptrend over the next few sessions.
Strong Fundamental Momentum: Beyond the Meme
Throughout June, Dogecoin has consolidated fundamentals that go beyond its meme-driven reputation. According to AInvest, there is a 51% probability of a DOGE ETF being approved in 2025, which could legitimize its adoption and attract institutional capital. This aligns with ongoing regulatory lobbying efforts from Coinbase, whose push for clearer rules on stablecoins and cross-border payments indirectly benefits DOGE.
Within the DeFi ecosystem, the integration of wrapped DOGE on Coinbase’s Base network has strengthened its use case, enabling functionality across decentralized applications. Community and developer engagement continue to support these developments; for instance, on-chain activity and the number of active DOGE addresses remain above average.
On the macroeconomic front, the Federal Reserve decided on June 11 to keep interest rates between 4.25% and 4.5%, while signaling potential rate cuts in the second half of the year. Markets are beginning to price in rate reductions starting in September. Reuters also highlights that the ceasefire agreement in the Middle East has lowered oil prices and reinforced dovish expectations, which tends to benefit risk-on assets like cryptocurrencies.
DOGE Technical Analysis
From a technical standpoint and based on the 4-hour chart, DOGE has clearly broken the descending trendline that formed after peaking at $0.25441 on May 23. It then corrected nearly 43% to bottom out at $0.14270 on June 22, which acted as dynamic support within a descending triangle formation. DOGE is currently trading at $0.16127, down 2.32% over the last 24 hours.
On the 4-hour chart, volume has moderately increased during the breakout, a positive sign—though stronger confirmation from institutional buying is still lacking. The EWO (Elliott Wave Oscillator) shows green bars with growing size, suggesting a shift from bearish to bullish momentum, which can precede impulsive moves if sustained above zero.
However, the technical outlook is starting to deteriorate. The RSI (14) has dropped to 43 with a clear downward slope, signaling weakening buying momentum. This level indicates that the price has lost relative strength, with no immediate signs of a reversal.
Meanwhile, the MACD has flipped from its prior bullish crossover and now shows a bearish configuration: the MACD line has crossed below the signal line, and the histogram has turned red again. This shift suggests a change in momentum, with sellers increasingly in control.
Conclusion and Scenarios
The recovery appears to have been canceled after failing to break through the $0.17 resistance and subsequently losing the critical $0.16 support level. Technical indicators confirm this deterioration: both the MACD and RSI now show bearish signals, reflecting increased selling pressure.
This setup reinforces a bearish scenario, with a high probability that the price will target the $0.145–$0.135 zone in the short term if no meaningful demand emerges.
Technical charts courtesy of TradingView.
Disclaimer: The opinions expressed do not constitute investment advice. If you are looking to make a purchase or investment, we recommend that you always do your research.
If you found this article interesting, here you can find more DOGECOIN News.