
- Bitcoin remains in a strong downtrend, falling from its all-time high of $126,272 to $80,537 in just six weeks, reflecting sustained selling pressure.
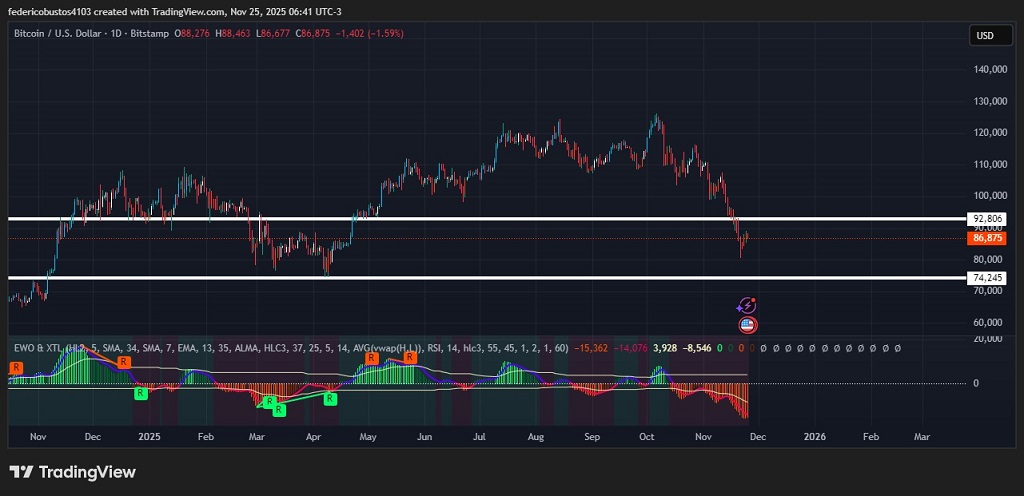
- BTC is currently trading at $86,875, within a critical range between $92,800 (resistance) and $74,200 (support).
- Technical indicators show oversold conditions and continued bearish momentum, with no clear signs of a rebound; any recovery will depend on volume and confirmed momentum shifts.
Institutional Pressure and Liquidations Define a Bearish Scenario for BTC
Since October 11, Bitcoin has experienced a sharp bearish move, dropping from its near all-time high of $126,272 down to $80,537 by Friday, November 21. This decline represents a loss of over 35% in just a little more than a month, signaling an abrupt shift in market sentiment.
A major factor behind this correction has been a mass institutional capital exit through spot Bitcoin ETFs. Exchange-traded funds have registered billions of dollars in redemptions during November, including roughly $3.5 billion in outflows to date. Additionally, non-Bitcoin crypto products have seen consecutive weeks of negative inflows, suggesting that institutional appetite for crypto is weakening.
The price drop has been accompanied by reduced liquidity and growing risk aversion: leveraged crypto positions have suffered tens of billions of dollars in liquidations, while investors retreat toward safer assets.
Technical Analysis of $BTC
From a technical standpoint, Bitcoin continues to show dominant bearish momentum. The price remains below the key resistance at $92,800 and is approaching the critical support at $74,200, a zone that has acted as a floor during previous corrections. Recent candlestick structures reflect continued selling pressure, with recovery attempts failing to reclaim higher levels. Current price: $86,875, with a 24-hour performance of -1.59%.
Trading volume has declined in recent sessions, indicating a lack of conviction from buyers. A significant rebound would require a sustained increase in volume, paired with daily closes above the nearest resistance. The Elliott Wave Oscillator (EWO) remains in negative territory, though recent bars show diminishing strength, which could set up a potential short-term technical reaction.
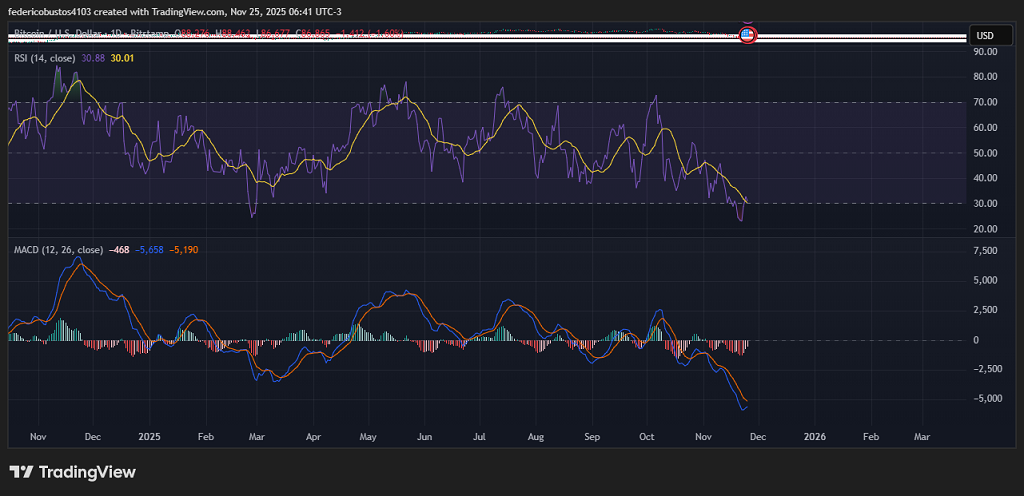
The RSI (14) at 30.88 reflects oversold conditions; however, its downward slope shows weak buying pressure. The MACD, with its signal line below zero and negative histogram bars, confirms the bearish trend. Still, a premature bullish crossover, if supported by a strong volume increase, could signal a momentum shift.
Conclusion and Possible Scenarios
BTC remains within the $92,800–$74,200 channel, with bearish pressure prevailing. A daily close above $92,800, supported by rising volume, could trigger a technical rebound toward $96,500 and $100,000.
On the other hand, a break below the intermediate support at $80,000 may deepen the correction, targeting the key support at $74,200. Until price action confirms its direction within this range, anticipation is risky and premature.
Technical charts courtesy of TradingView.
Disclaimer: The opinions expressed do not constitute investment advice. If you are looking to make a purchase or investment, we recommend that you always do your research.
If you found this article interesting, here you can find more Bitcoin News.