Ripple is presently lodged at seventh, stable on week-to-date and currently consolidating. Technically, XRP buyers appear exhausted.
At the time of writing, gains of early last week have been reversed, and XRP/USD prices are back in consolidation inside the wedge.
The slowdown down could be due to Bitcoin’s contagion. As visible from the daily chart, a positive correlation between Bitcoin and altcoin impacts XRP—despite periods of decoupling before the SEC suit.
Therefore, with contracting Bitcoin prices, XRP has been forced down. Even still, the uptrend is valid provided XRP buyers sustain prices above critical support levels.
XRP Will Take Off After the SEC Settles with Ripple
Fundamental factors influencing prices range from the ongoing SEC court case.
It has been back-and-forth with Ripple lawyers even appealing to force the agency to release critical information, helpful, supporting their defense.
There is no doubt that the case pins down XRP.
However, once clarity is found through a favorable settlement, XRP will erupt, lifting the crypto market with it.
It is precisely what many other analysts have reiterated. Now, crypto influencer David Gokhshtein, in a recent tweet, is reiterating the same.
Once Ripple settles their case, you’ll see now only $XRP take off, but the market as well.
That’s because we’ll finally have some sort of clarity that will be available.
Personal Opinion.
NFA
— David Gokhshtein (@davidgokhshtein) October 22, 2021
The crux, and what’s keeping this case high profile, is the resulting clarity on XRP and other coins that the SEC claims are securities. The unshackling of XRP and Ripple Labs from this classification would draw even more business and partners to their solutions, boosting XRP.
Ripple Price Analysis
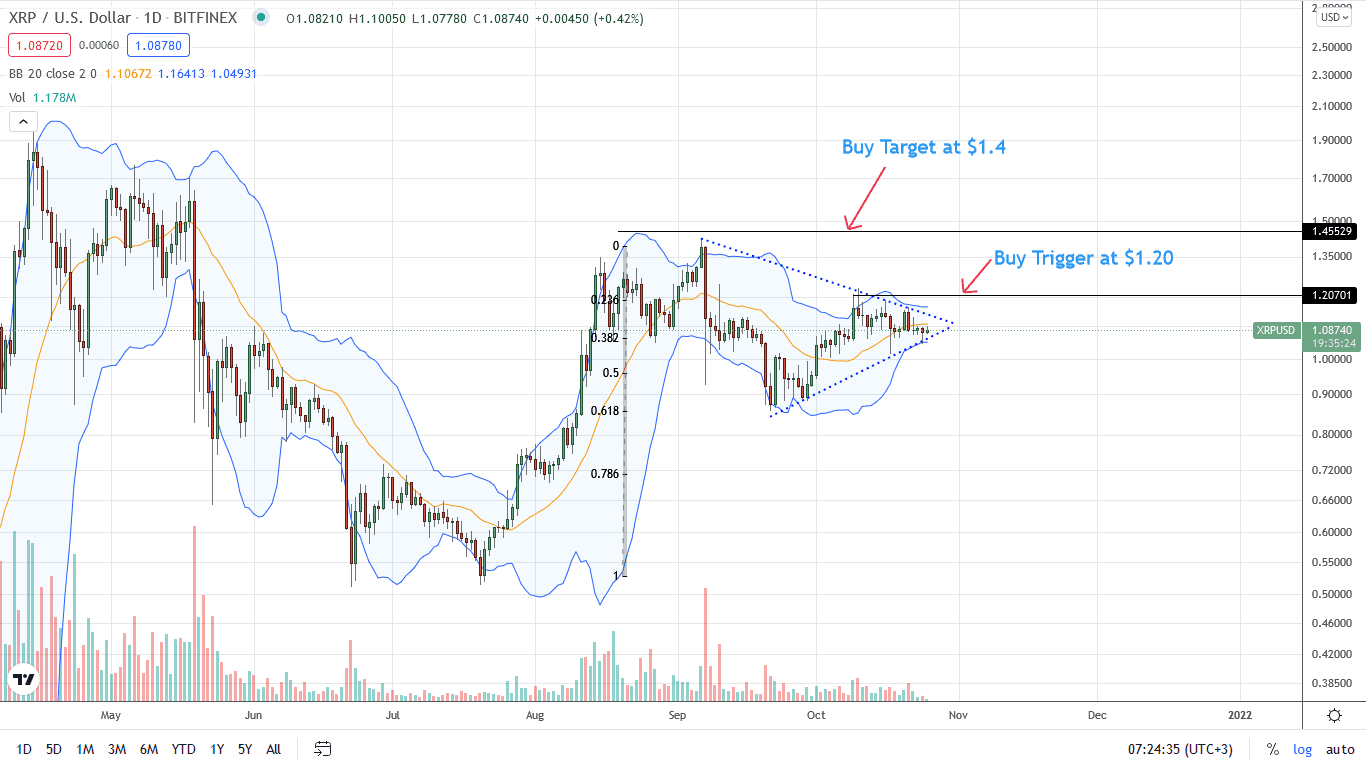
From the daily chart, XRP/USD prices are in range, oscillating in a tight $0.22 zone above the psychological $1 support.
Presently, XRP prices are inside a descending wedge, pulling back after attempts of a close above the primary resistance trend line. A close above $.120 would—as determined from the candlestick arrangement in the daily chart—force XRP towards $1.40 in a buy trend continuation pattern.
However, if bears press lower below $1 in sync with losses of September and to mirror the visible, wide-ranging, high-volume bear candlestick of September 7, XRP may drop to $0.85. This is a crucial reaction point anchoring Ripple prices. Coincidentally, it also flashes with September 2021 lows of around $0.85.
Reading from XRP technical analysis in the daily chart, traders can adopt a wait-and-see approach, waiting for a sharp close in either direction before committing.
Technical charts courtesy of Trading View
Disclaimer: Opinions expressed are not investment advice. Do your research.
If you found this article interesting, here you can find more Ripple news