
Throughout the last months of 2023, the price of Polygon (MATIC) has experienced a journey marked by a series of significant movements in its value, reflecting a trend that has captured the attention of crypto market investors and analysts.
Currently, MATIC is trading at $0.86, registering an increase of 3.62% in the last day.
It ranks #14 in terms of market capitalization, valuing it at $8.04 billion, according to data from CoinMarketCap.
It is crucial to understand Polygon’s price trajectory: its all-time high, recorded on December 26, 2021, reached $2.92, while its all-time low, occurred on May 9, 2019 at $0.003012.
Over the past seven days, Polygon has seen a notable 7.51% increase in its value, signaling solid growth in this short span.
A DETAIL LOOK AT POLYGON THESE LAST MONTHS
The technical analysis of the asset details a pattern of fluctuations that reveals the influence of multiple factors on its trajectory.
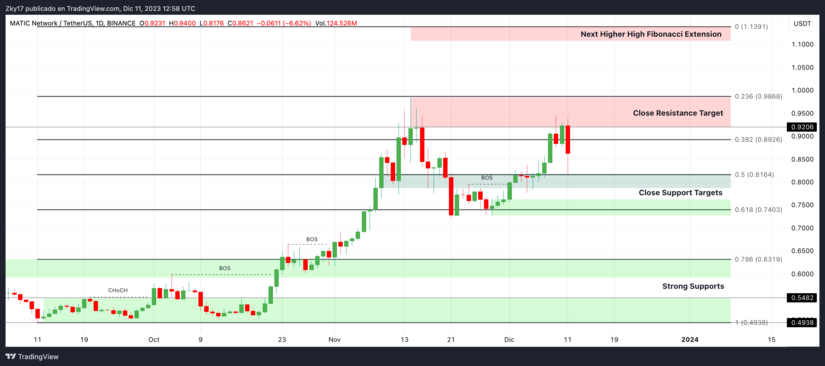
From September to mid-October, Polygon remained in a consolidation range, oscillating between 0.41 and 0.55 cents.
However, in mid-October, it experienced a bullish breakout, driven by the dynamism of the cryptocurrency market, especially the rise of Bitcoin.
This push contributed to MATIC reaching new highs around $0.98.
However, after reaching this mark, Polygon faced considerable resistance in the 92 to 98 cent range, prompting an abrupt reversal.
At the end of November, the price retreated towards supports, standing between 75 and 82 cents.
This support zone was reinforced by a rebound in demand during early December.
Technical analyzes are based on the identification of critical support and resistance zones, as well as the evaluation of price history.
Using Fibonacci extension tools, the 0.618 level can be highlighted, which coincides with the support of 74 cents.
Looking ahead, it is projected that if Polygon manages to break above its previous highs, it could head towards even higher levels following these patterns, such as the threshold of $1.11 or even $1.25.
These possible scenarios are conditioned by the crypto’s ability to break established resistances and consolidate its bullish momentum.
Technical charts courtesy of TradingView.
Disclaimer: The opinions expressed do not constitute investment advice.If you are looking to make a purchase or investment, we recommend that you always do your research.
If you found this article interesting, you can find more Polygon News here.