TL;DR
- Peter Brandt uses a sailing ship metaphor to illustrate retail investor panic during Bitcoin’s current correction.
- He notes MicroStrategy will hold, but retail holders may capitulate, amplifying the sell-off.
- His analysis foresees more downside volatility and tests of key supports before a potential consolidation in mid/late 2026.
Veteran trader Peter Brandt posted a chart on February 2nd accompanied by a meme that captures Bitcoin’s current situation. The cryptocurrency dropped from $65,500 to consolidate around $54,956, and Brandt illustrates the moment with a sailboat named “Sayl_boat” —a clear reference to Michael Saylor— from which several passengers jump into the water gripped by panic. The question he poses is blunt: “When will investors want to abandon ship? Strategy will hold up well, but what about its investors?“
Brandt has been trading futures for decades and his technical analysis enjoys global recognition. With this message he highlights two parallel scenarios. Strategy will resist thanks to its sustained accumulation and debt acquired in previous cycles at favorable rates. However, retail holders tend to capitulate during sharp corrections, amplifying sales and deepening downturns.
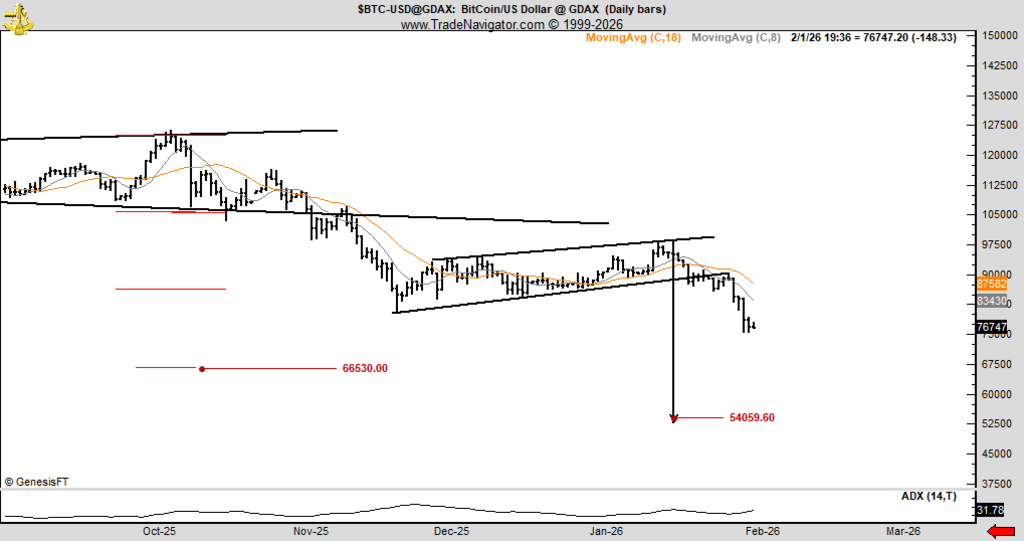
His recent forecasts point toward key support levels in the $58,000–$62,000 range. Brandt has identified completed bearish patterns and considers it necessary for Bitcoin to reclaim $93,000 to invalidate selling pressure.
In previous conversations he mentioned possible lows between August and October 2026, followed by a vertical rally once the floor is located. While he acknowledges that historical parabolic breakdowns typically result in declines exceeding 75%, he no longer insists as much on the extreme $25,000 targets he projected in 2025.
The analyst rules out any episode of impulsive buying in the short term
He anticipates increased downside volatility and tests of the mentioned support levels, including occasional dips below. If retail panic intensifies, selling could temporarily accelerate. Nevertheless, Brandt does not adopt a permanently pessimistic stance: he expects that, after clearing stop orders and consolidating a solid base toward mid or late 2026, BTC will resume its uptrend with strength.
Despite the cautious tone, Brandt places Bitcoin within a supercycle comparable only to gold. His final message is clear: the short term demands caution; the medium term offers accumulation windows for those who can tolerate turbulence. As he himself admits: “I’m wrong 50% of the time and it doesn’t bother me to be wrong.” Even so, his current technical reading demands prudence rather than euphoria.
Why is Bitcoin Holding Strong? Key Signs of Institutional Control and Support
As of today, February 2, 2026, Bitcoin (BTC) is trading around $79,000 USD, consolidating within a market structure that is clearly dominated by institutional participation.
 is trading around $79,000 USD")
From the Open Interest (OI) perspective, there is a sustained increase in futures open interest, particularly across high-liquidity exchanges. This behavior signals capital inflows from institutional players and leveraged traders, rather than short-term speculative activity.

What stands out is that this OI growth is not accompanied by aggressive liquidation events, suggesting the market is building positions instead of closing them, a condition typically associated with bullish continuation during advanced consolidation phases.
 BTC")
Regarding Simple Moving Averages (SMA), Bitcoin’s price remains above the SMA 50, SMA 100, and SMA 200, all of which show a positive upward slope. This technical alignment is characteristic of a healthy macro-bullish trend. Additionally, the SMA 50 is acting as support, reinforcing the idea that current pullbacks are corrective rather than structural. As long as price holds above the SMA 200, the long-term bias remains firmly bullish.

From a Smart Money standpoint, current price action reflects accumulation within high-liquidity zones, particularly following local low sweeps (liquidity grabs). These areas are commonly used by traders to absorb retail selling pressure ahead of expansionary moves. The present structure shows higher highs and higher lows, with impulsive moves followed by orderly consolidations—classic signatures of institutional control over market flow.