
TL;DR
- Bitcoin trades at $68,512 after facing rejection near the $70,000 resistance level.
- A death cross appears on the three-day chart for the first time since 2022.
- Short-term indicators show selling pressure weakening despite the bearish long-term signal.
Bitcoin faces a defining technical test at the $70,000 level on March 3, 2026. The cryptocurrency trades at $68,512 after recording an intraday high of $69,510 and a low of $66,326. Price met resistance near the psychological $70,000 mark for the third time in recent weeks, consolidating that zone as the market’s immediate ceiling.
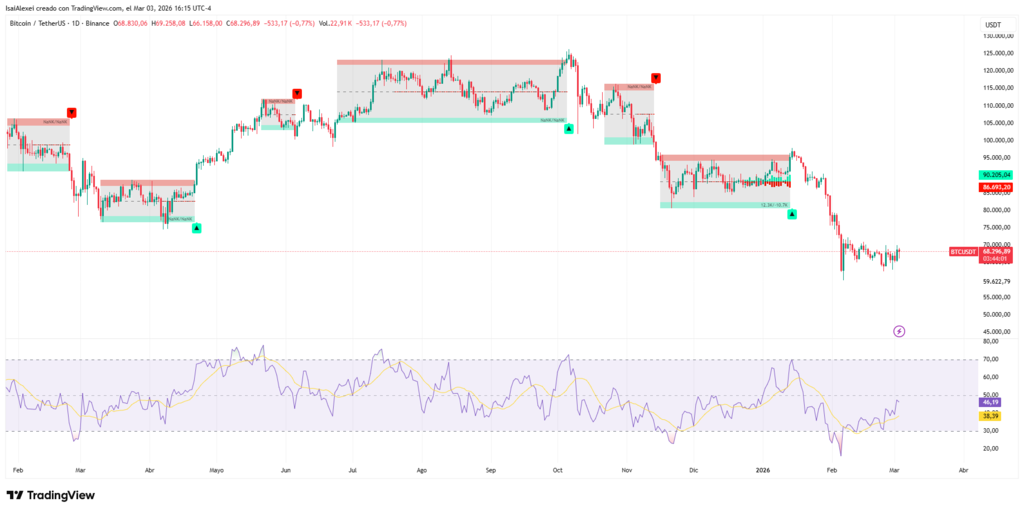
Sellers appeared near $69,500 during the session, but buyers defended intraday support at $67,800. Price action reflects a direct struggle between those betting on a continued uptrend and those anticipating a deeper correction. The daily RSI stands at 46, in neutral territory with a slightly bullish bias, while the MACD remains negative without confirming a trend reversal crossover.
Short and long-term technical signals
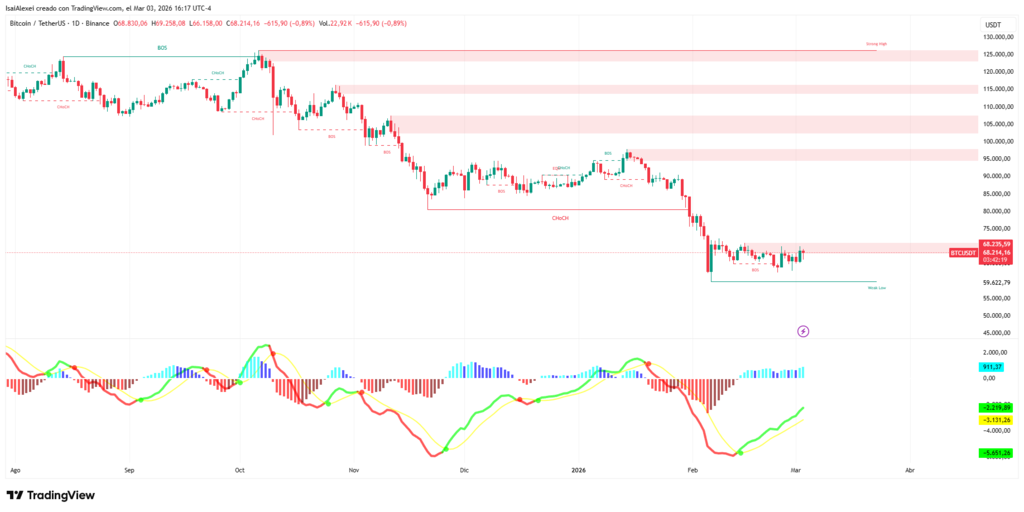
The three-day chart shows a death cross for the first time since 2022. The 50-period moving average cut below the 200-period average, a pattern that historically preceded corrections of up to 35%. This indicator generates caution among traders, who closely watch support levels at $65,000 and $62,500. A loss of these zones could accelerate selling toward $60,000.
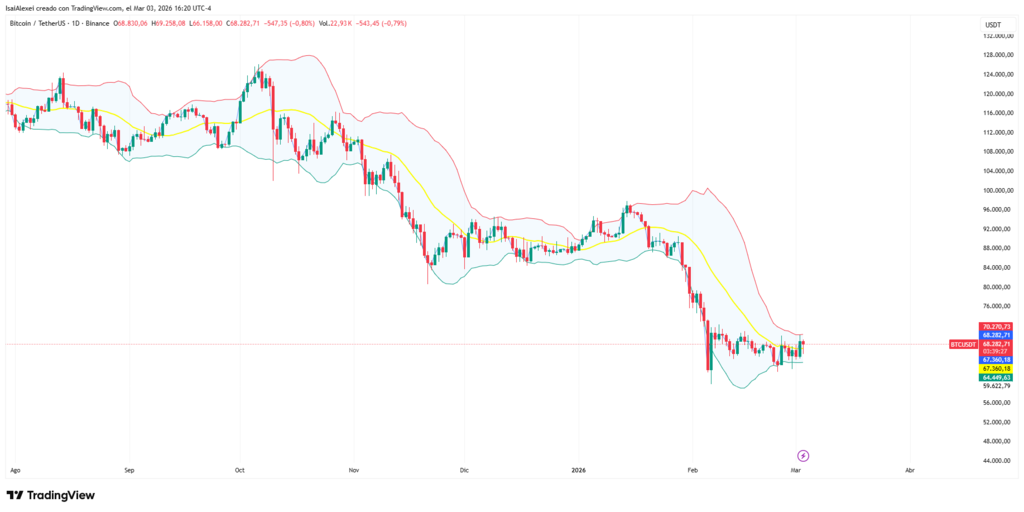
However, short-term indicators contradict this bearish signal. Bitcoin recovered its 20-day moving average and Bollinger Bands are tightening, a configuration that precedes sharp price moves. Research firm 10x Research notes that selling pressure is dissipating and that the hourly RSI shows recovery. Analyst Michaël van de Poppe argues that consolidation above $65,000 builds momentum for a bullish breakout.
That's the type of test that I was looking for with the markets.
Quick turn-around upwards on $BTC.
Massive.
It's actually the strongest asset out of all assets today (except for oil). pic.twitter.com/4nz10YSyr5
— Michaël van de Poppe (@CryptoMichNL) March 3, 2026
Key levels define the immediate scenario
To the upside, main resistance extends between $70,000 and $72,000. A daily close above that band, accompanied by rising volume, would open the path toward $76,000. To the downside, immediate support at $66,500 is critical. A break below that level would send price to test the $65,000 zone first and then $62,500.
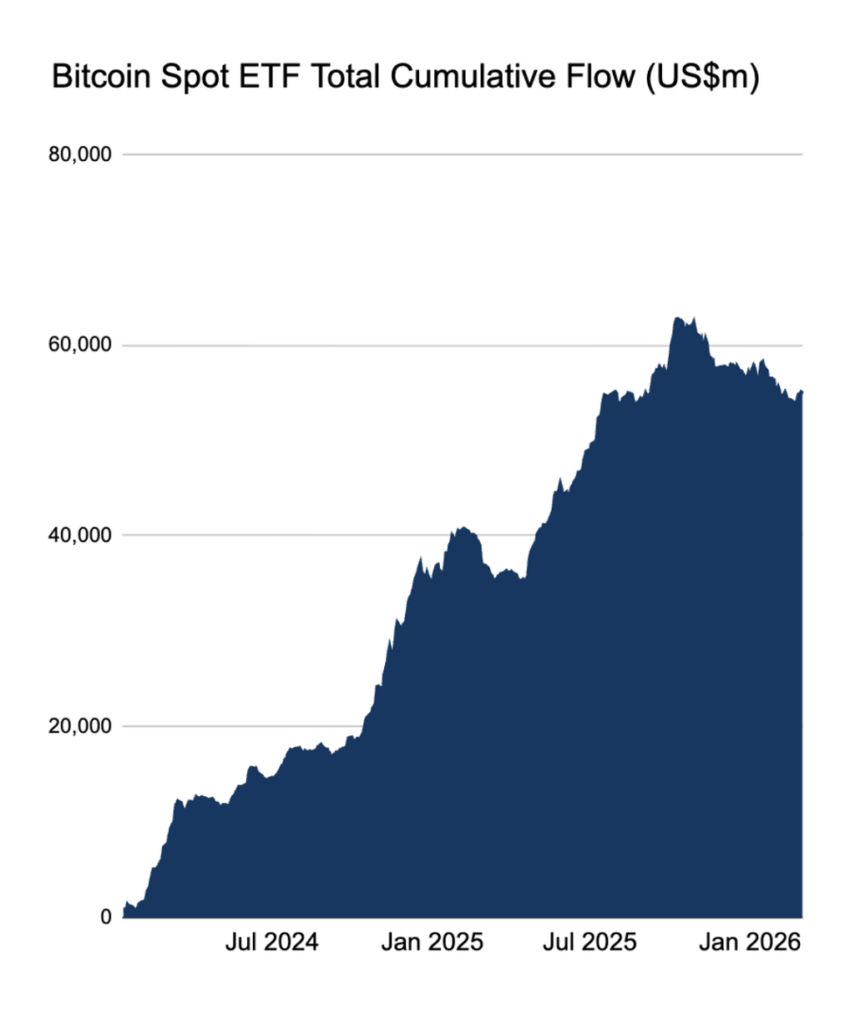
US spot Bitcoin ETFs recorded inflows of $458 million on March 2, indicating institutional demand on dips. In contrast, miner Core Scientific announced the sale of most of its Bitcoin holdings to fund its expansion into artificial intelligence, a decision that could increase available supply in the market.
Bitcoin accumulates five consecutive monthly declines, a streak only seen during the 2018-2019 bear market. On that occasion, that negative sequence was followed by a 300% rebound in the subsequent five months.
The current unknown is whether the recent bottom near $65,000 represents a genuine floor or if the market needs an additional correction to find buyers. The outcome of the test at $70,000 will define the direction for the coming weeks.