TL;DR
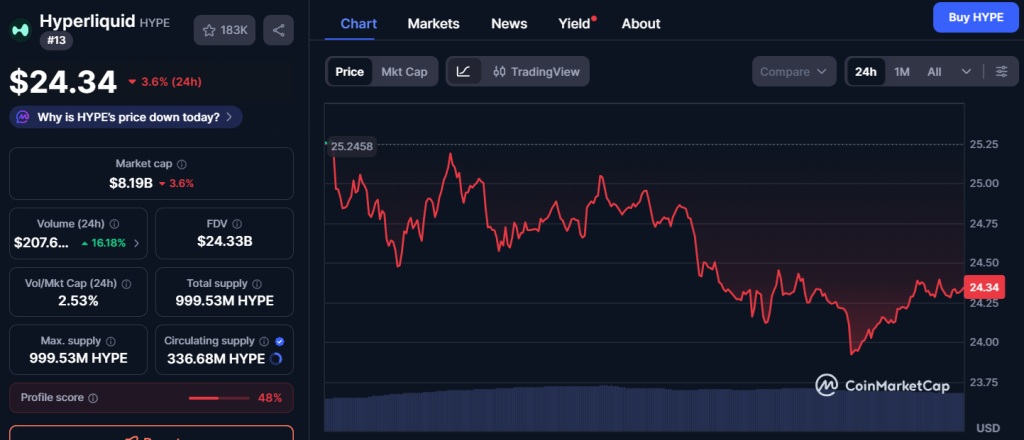
- Hyperliquid shows weakness after losing its recent highs: the token trades at $24.34, down 3.6%, with volume exceeding $207 million.
- The rejection at resistance triggered a sequence of lower highs and lower lows, with brief rebounds and recurring selling that leave the price just above support.
- The $24 level is key for the market: a break would open the door to lower levels, while the $24.80–$25.00 zone acts as immediate resistance.
Hyperliquid is going through a weak phase after losing its recent highs. The HYPE token failed to hold the $25.4–$25.5 zone and, following that rejection, entered a sequence of lower highs and lower lows. It is currently trading around $24.34 after a 3.6% decline, while volume rose 16% and now exceeds $207 million.
Hyperliquid shows orderly bearish price action. After the rejection at resistance, the price fell and then attempted brief rebounds that quickly ran out of momentum. Each recovery met renewed waves of selling, clearly indicating that demand is insufficient to reclaim previous levels. The $24.30–$24.40 zone helped slow the initial drop, but it failed to generate consistent buying. The market shifted from an attempt at stabilization to a waiting phase, with the price hovering just above support.
The volume recorded by Hyperliquid confirms this interpretation. Downward moves were accompanied by clear spikes in selling activity, while rebounds occurred on lower volume. This imbalance points to a distribution process rather than defensive accumulation. Selling pressure dominates capital flows, even when the price attempts to bounce.
Technical Analysis of Hyperliquid
From a technical perspective, $24 is a key short-term level. The lack of reaction in that area suggests that traders are waiting. A break below this level would leave the token without nearby structural demand references and could trigger a move toward lower psychological levels. On the upside, the $24.80–$25.00 range has flipped into resistance. Only a sustained recovery above that zone could alter the current bearish structure.
HYPE trades well below its 50-day simple moving average at $33.78 and its 200-day simple moving average at $34.47, highlighting the scale of the decline. Volatility stands at 11.70%, a very high level that explains the abrupt moves and intraday instability. The 14-day RSI sits at 37.93, near oversold territory, indicating a slowdown in bearish momentum but not a confirmed trend reversal