
Year-to-date, the Ethereum price has outperformed the USD— 1.6X, and BTC–despite the coin’s stellar gains from late October 2020.
At the time of this article’s writing, BTC was trading above $18,100. It is at a three-year high, levels last registered in early 2018. That is before the damaging crypto winter that saw Ethereum prices collapse from over $1,200 to around $100.
Since then, regulators have stepped in and sanity has returned. Still, the Ethereum price is yet to recover gains of the ICO-induced rally of Q4 2020. There are tell-tale signs bulls are readying for a rally and a possible break above $500 to a modest target of $600 by the end of the year.
While investors are focused on Bitcoin, investors are eyeing Ethereum for good reasons. Aside from the year-to-date gains, they have a positive correlation. As such, it appears the current stagnation is a chance for another accumulation for ETH bulls.
One analyst posted his view on Twitter, stating:
“If ETH continues on in this manner and is in fact one market cycle behind BTC, then we make peak at approximately 1,000 percent above the fair value in a few years. If this happens in say, 2023, then this could put a theoretical peak just shy of a modest $10k per ETH.”
Ethereum Price Analysis
The Ethereum price trajectory in lower timeframes is bullish. In the last week of trading, the coin is up six percent versus the greenback but trailing BTC.
Fundamentals factors like the renewed interest in DeFi and the success of Eth2 may pump prices above liquidation levels.
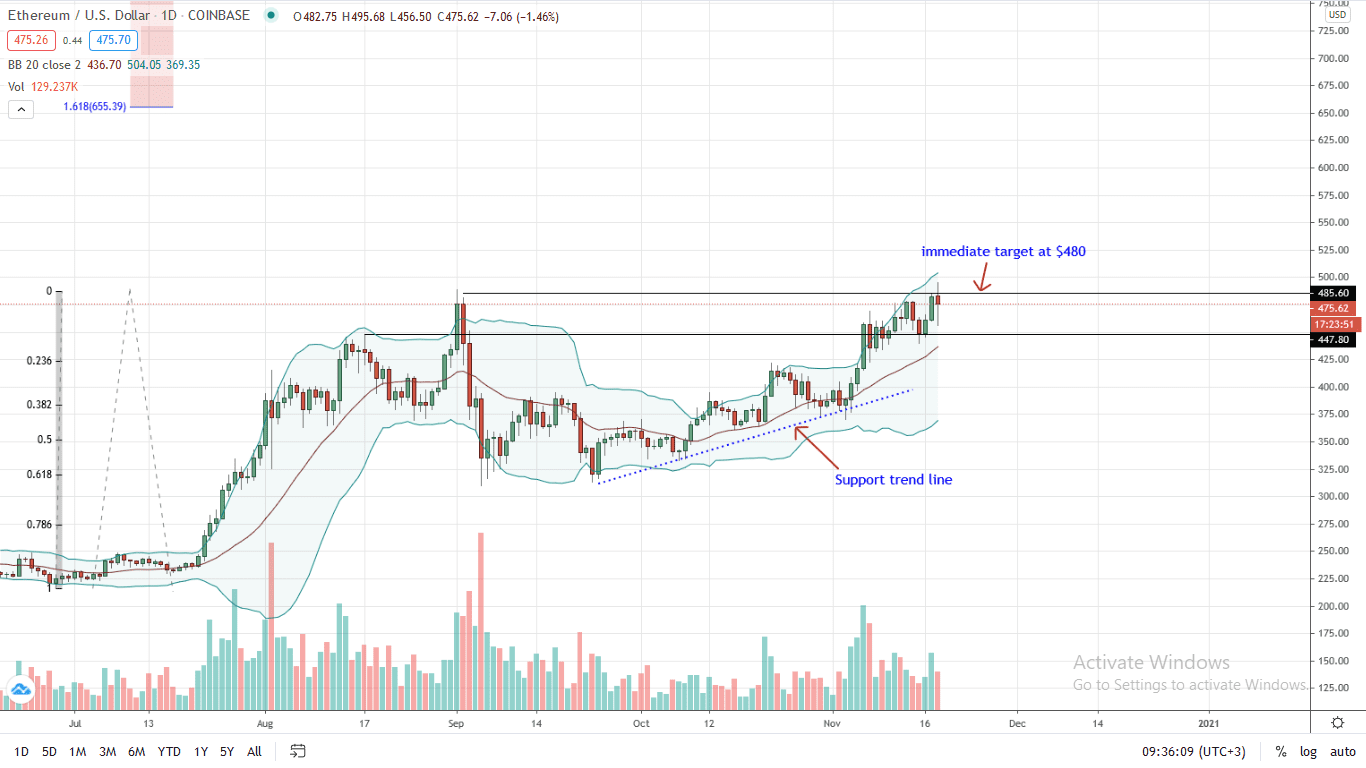
However, traders are adopting a wait-and-see approach. From the daily chart, prices are consolidating inside late last week’s trade range. Technically bullish presenting an opportunity for traders to ramp up on dips, resistance lies at last week’s high at around $480.
For buy trend continuation, there must be a high volume break and close above $480. Such a move will not only nullify bear attempts of early September but signal the beginning of a climb to $650. Anchoring the Fibonacci extension levels at July to August trade range shows that possible reaction points are at $650—the 1.618 level, and $920—the 1.618.
Support is provided by the middle BB and $430. Losses below this point could trigger a deep correction towards $420 or Oct 2020 high.
Chart courtesy of Trading View
Disclaimer: Views and opinions expressed are those of the author. This is not investment advice. Do your research.
If you found this article interesting, here you can find more Ethereum News