The Ethereum—and broadly, the crypto market—are under immense selling pressure. Thus far, ETH is down roughly 35 percent from peaks, in sync with the value erosion in Bitcoin. The drawdown was expected and could continue for an extended period considering the cyclic nature of cryptocurrencies.
The Cool-Off
After two years of near perpendicular growth, the cool-off forces weak hands out of the crypto equation through profit-taking.
Like in 2018, Ethereum prices could dump, even reaching the 50 percent—or worse—levels. The good news is, unlike the crypto winter of four years ago, the crypto market is relatively resilient with products with real-world utility.
At the moment, DeFi could be taking a beating reading from the contraction of assets under management. However, this is countered by the billions flowing to NFTs and blockchain gaming, of which most projects utilize Ethereum’s rails.
NFTs, trackers show, are growing stronger—outperforming crypto and DeFi—two domains that are recoiling from all-time highs—as prices cool off.
ETH Holders are Unfazed
Encouragingly, ETH holders are also unfazed by events factoring in the myriad opportunities presented by NFTs. Onchain data reveals that the number of ETH holders stands at record levels.
By mid-January 2022, there were over 68 million ETH holders.
Furthermore, despite the rocky state of price action, the number of active Ethereum addresses maintains an upward trend averaging over 1.2 million every day.
Other encouraging data shows that EIP-1559 is yielding dividends, making ETH scarcer than Bitcoin, a positive development when inflation in the U.S. continues to expand, rising to seven percent in December 2021.
Ethereum Price Analysis
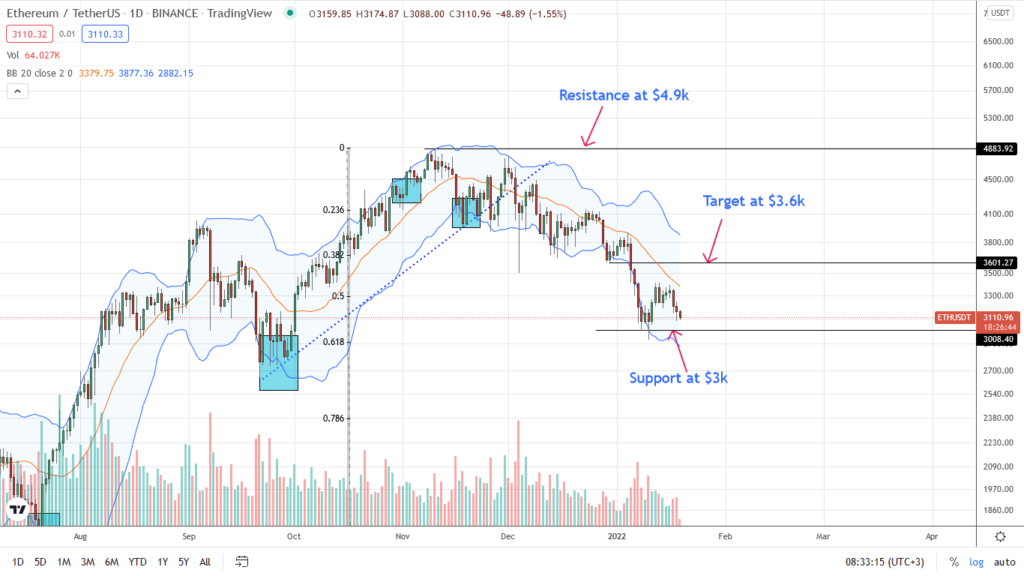
ETH prices are printing lower lows, capped below the dynamic resistance line of the middle BB. Although losses are not as steep as in other assets, sellers are in control, provided the ETHUSDT trend is below the $3.4k and $3.6k resistance levels.
If there is confirmation of January 18 losses, ETH may crumble below $3k. In that case, bears may step up, triggering a sell-off towards $2.7k—the September 2021 lows—and later, $2.4k—the 78.6 percent Fibonacci retracement level of the H2 2021 trade range.
Conversely, there will be hope for buyers if there is a slowdown from spot rates. Steady gains above $3.4k may be the foundation for a move higher above the 20-day moving average and $3.6k back towards $4k.
Technical charts courtesy of Trading View
Disclaimer: Opinions expressed are not investment advice. Do your research.
If you found this article interesting, here you can find more Ethereum News


