Ethereum activity continues to increase going into Serenity. While there might be hitches and delays—which are typical of open source blockchain projects, the fact that developers are unwavering and steady is a net positive going forward.
Specifically, Serenity is bullish for the network since several weakness present—and inherent in Proof-of-Work systems are alleviated.
Case in point is energy efficiency which Bitcoin and similar protocols are known for. Then there are centralization concerns as corporates muscle out weak miners.
The hopes of Serenity
Over and above everything, a shift to an alternative yet efficient consensus style will unlock the true potential of the network and expand the number of possibilities.
Chief amongst them being scalability of which Ethereum needs to resolve as the network activity picks up and more project shifts to the smart contracting platform.
Price wise, these are checkboxes to indicate confidence and that could explain why Ethereum miners—unlike Bitcoin’s, are holding the coin regardless of price performance.
ETH exchange flow
Parallel data from Glass Node also shows that unlike BTC which is rapidly being shifted away from exchanges, traders appear to be accumulating the second most valuable coin for good reasons.
A proper re-evaluation of the network’s fundamentals reveal that there are high chances that ETH, at spot rates, may be undervalued.
Extending this means that odds of ETH leading the next wave of a crypto rally is extremely high more so if the transition to ETH 2.0 is smooth, and the network actually works, resolving scalability hitches.
ETH/USD Price Analysis
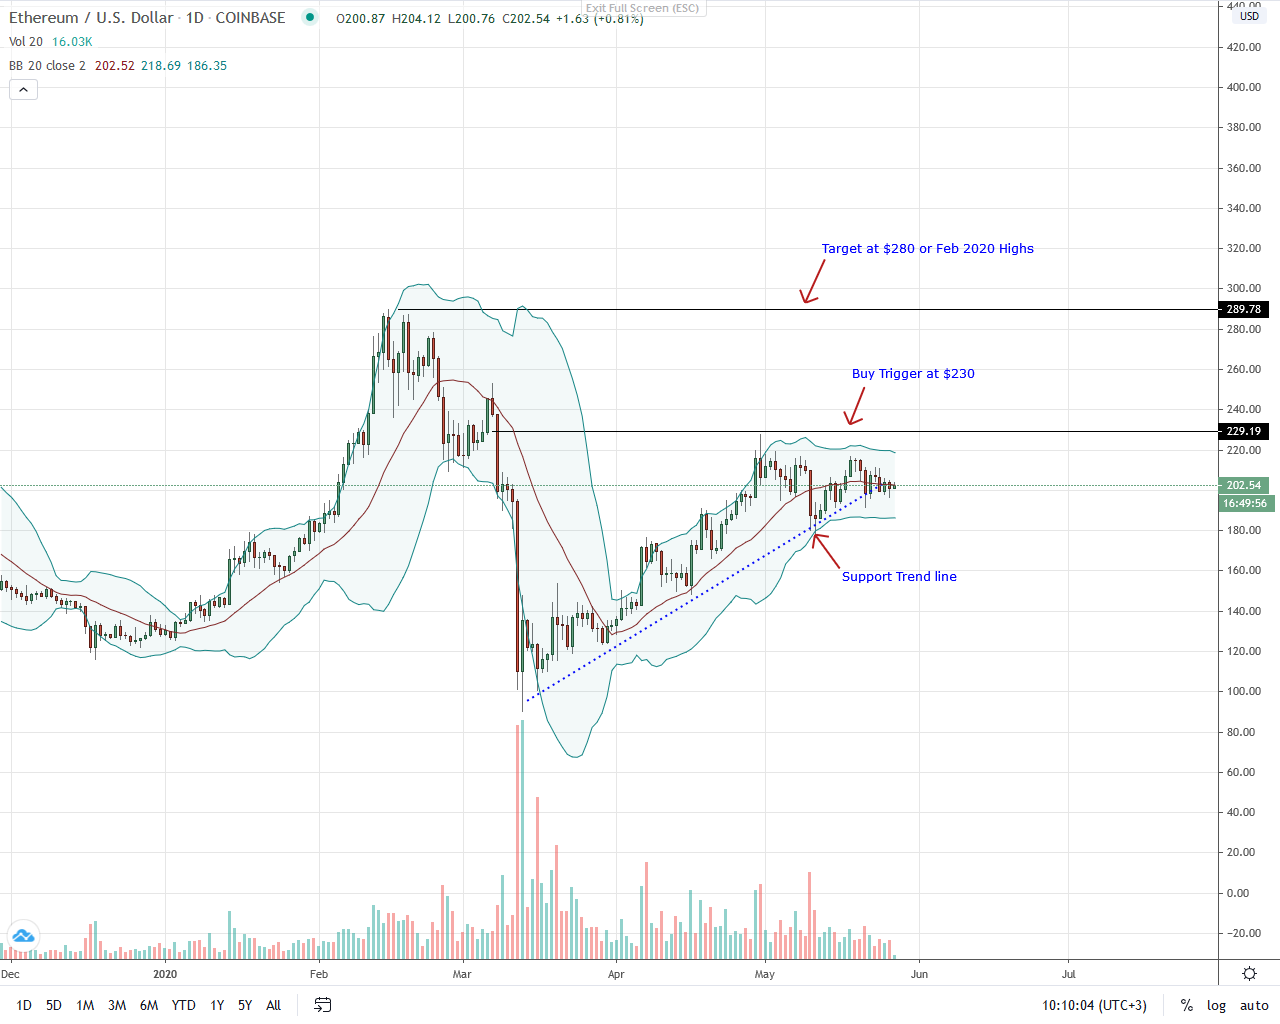
ETH prices are stagnant and at the $200 level. Oscillating tightly inside a trade range with caps at $190, there is no clear signal to where price might trend.
However, with sellers pressing lower and on the brink of pushing ETH below the main support trend line and $190, it is vital that bulls reject attempts that may drive prices below $180—May 2020 lows.
For buyers to be truly in charge, prices must not only clear the 20-day moving average marked by the middle BB, but $220 and preferably $230 for a bull trend continuation pattern of Q1 2020.
A break and close above $230 could draw buyers aiming at $280 (Feb 2020 highs). If on the other hand, bears take charge and price fail to hold at $190 as bears take charge, sellers of May 10 may flow back confirming the lower lows of late April to mid-May 2020.
Should break-out volumes be above average and prices below the main support trend line, ETH may drag to $180 and $150.
Disclaimer: This is not investment advice. Opinions expressed here are those of the author and not the view of the publication.
If you found this article interesting, here you can find more Ethereum News


