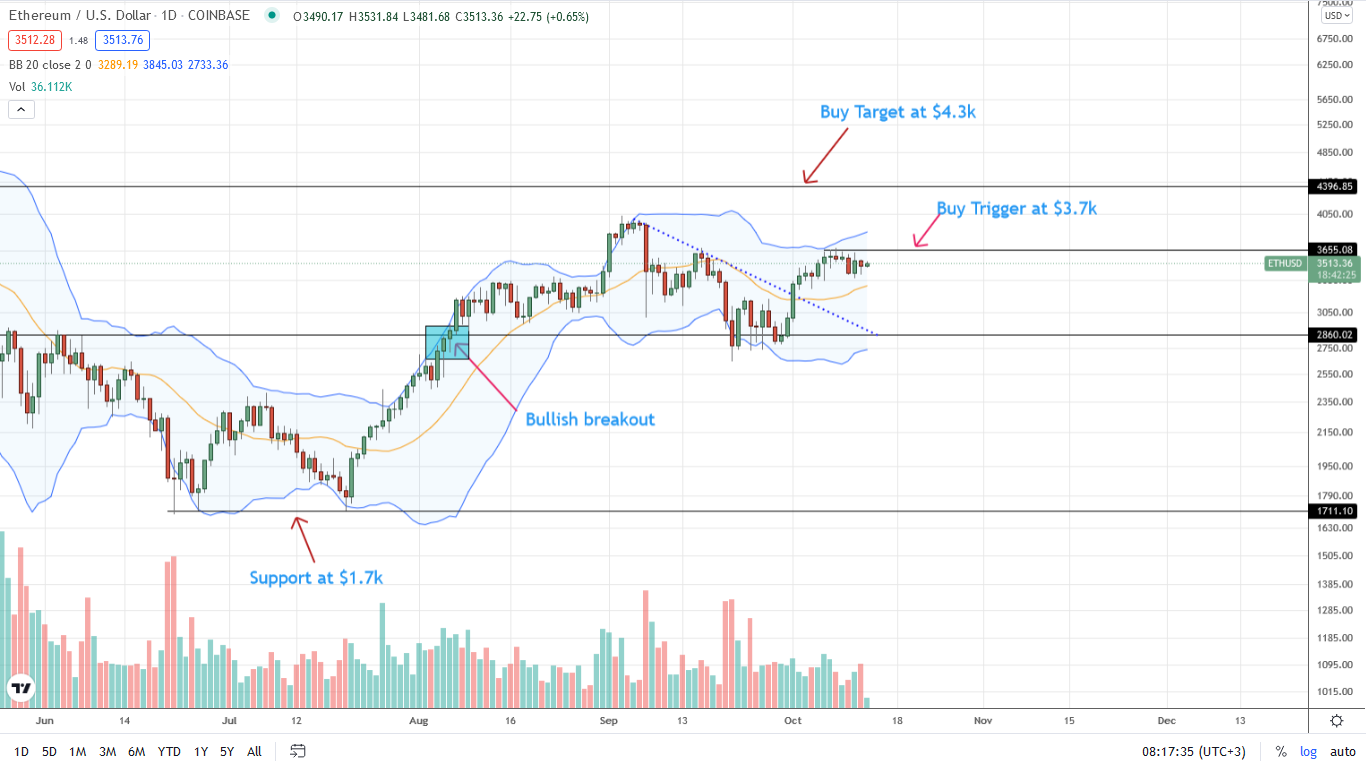
Ethereum price uptrend seems to be stalling at the time of writing. Admittedly, the crypto scene is bubbly, apparently shifting sight on Bitcoin that could, in one single push, retest all-time highs.
From the daily chart, the path of least resistance remains northwards. The coin is steady, adding two percent on the last trading day versus the greenback.
Even so, how ETH prices expand in the short term depends on fundamental events that may stem from the ecosystem or Bitcoin.
For instance, if the SEC approves a Bitcoin ETF, ETH prices would most likely rip higher as the community believes the green-lighting of a similar product would be on the offing.
Gas Fees Prohibitively High?
At present, though, the primary driver of ETH price is NFTs and the development in DeFi and the space. While there were changes to Gas auctioning, fees remain prohibitively expensive for artists and users looking to be part of the fold as proud NFT holders. As Vinny Lingham notes, Gas rates are outrageous.
This is why Ethereum is broken…I just tried to mint an NFT on a new drop. pic.twitter.com/zg8hwMQb61
— Vinny Lingham (@VinnyLingham) October 11, 2021
This could be the experience of most users minting their NFTs on-chain instead of Layer-2 options like Immutable X. At this rate, users could be discouraged from interacting with the primary chain since OpenSea—and by extension NFTs—is the most active considering the ETH burned through EIP-1559.
Ethereum Price Analysis
ETH is steady versus the greenback on the last trading day at the time of writing. While it may be in green week-to-date, there are signs of weakness.
This is further compounded by the failure of bulls to follow through and close above $3.7k. There are lower lows relative to the upper BB, and at the same time, trading volumes are comparatively low.
Nonetheless, a close above $3.7k may see ETH float back to $4k or better in subsequent sessions. On the flip side, deeper losses below $3.3k and the middle BB may ignite a sell-off in sync with September 2021 bear trend, forcing ETH back to $2.8k in a sell trend continuation pattern.
Should this pan out, the M-Formation clear in the daily chart would be complete, signaling peaks.
Technical charts courtesy of Trading View
Disclaimer: Opinions expressed are not investment advice. Do your research.
If you found this article interesting, here you can find more Ethereum News


