Optimism in the cryptocurrency market skedaddled after a brief accumulation period. Just when Bitcoin and the rest of the altcoins appeared to be bouncing off support levels. While a few tokens decoupled with the broader market to post significant gains, the cumulative valuation fell to $1.30 trillion.
Cosmos [ATOM] gets pushed to the downside
Cosmos slashed all its weekly gains following the back-to-back pullback as the incessant consolidation took a major bearish turn. Over the past day, it was down by 8.45% which pushed the asset to a price of $11.02. At the time of writing, ATOM recorded a market cap of $2.39 billion and a 24-hour trading volume of $200 million.
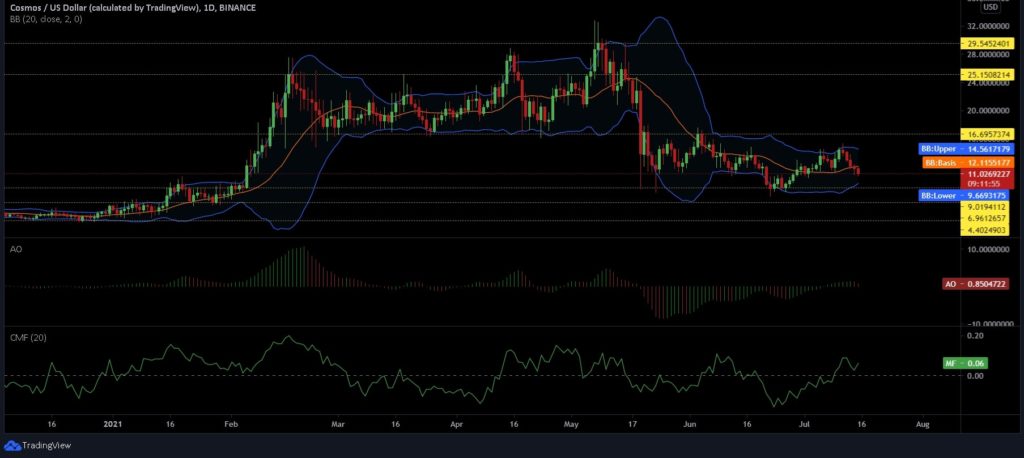
The squeeze in Bollinger Bands depicted a less volatile period for ATOM. The formation of red closing bars depicted a shift towards bearish momentum. The Chaikin Money Flow [CMF], however, portrayed a contradictory picture of increasing capital inflow in the coin market.
Cosmos could face $16.69 in case of a bullish reversal, before targeting other resistance levels of $25.15, and $29.5. The support levels stood firm at $9.09, $6.96, and $4.40.
VeChain [VET] buyers could take over the volume
After four consecutive red candles, VeChain’s weekly losses totaled 9.02%. At a price of $0.0698, the crypto-asset was now trading close to a crucial support line while sitting at a market cap of $4.46 billion. Over the past 24-hours, VET dropped by 4.77% which drove its trading volume to $394 million.
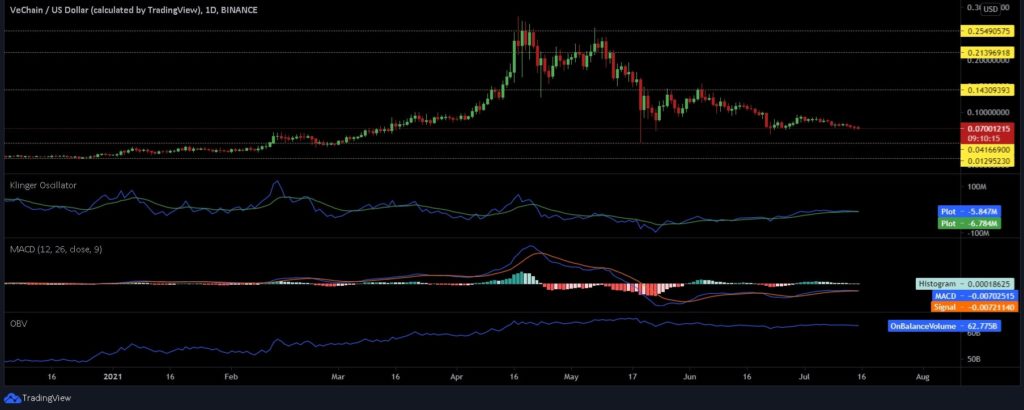
Klinger Oscillator [KO] was on the brink of a bearish crossover. So was the case with MACD as it turned towards the bear indicating that the buying pressure could have exhausted. The OBV, on the other hand, depicted consistent volume in the VET market.
If the bears sink the price, VET could revisit its nearest support area of $0.04, a further downside could trigger a fall to $0.0129. The resistance levels for the asset were found to be at $0.143, $0.213, and $0.254 respectively.
Stellar [XLM] sellers looking for an entry to short
Similar to many of its peer assets, Stellar has been hovering at a critical support region, a fall from which could prove damaging. It declined by 2.80% over the past 24-hours and was currently priced at $0.231. XLM held a market cap of $5.38 billion and a 24-hour trading volume of $420 million.
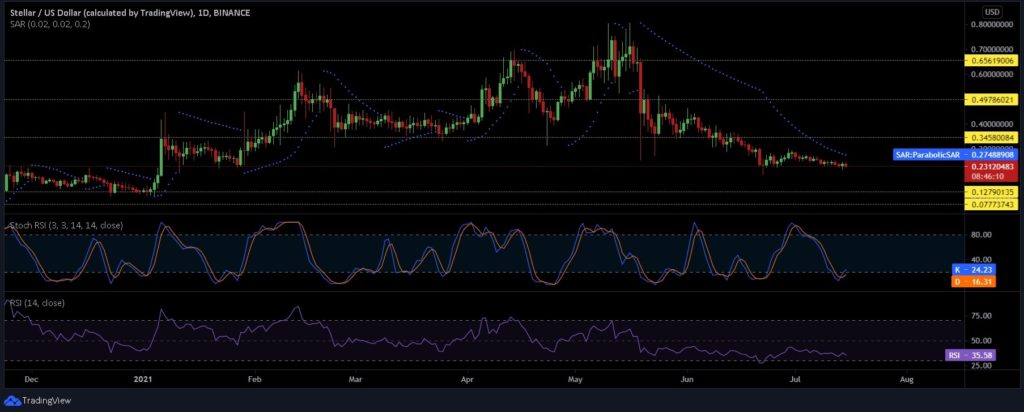
The dotted markers of the Parabolic SAR continued to hover above the Stellar candles, a pattern that has been in continuation since the mid-May pullback. The Stochastic RSI underwent a bullish crossover as it bounced from the extreme oversold region depicting a potential bullish reversal in XLM’s price. The RSI, however, settled close to the oversold conditions with no hints of rebound indicating an increasing selling pressure in the coin market.
If strong hands happen to enter the Stellar market, its price could surge to immediate resistance levels of $0.345, $0.497, and $0.656. On the flip side, the support levels were at $0.127, and $0.077
If you found this article interesting, here you can find more Blockchain and cryptocurrency news