TL;DR
- Cardano (ADA) trades at $0.272, below its key moving averages, signaling selling pressure.
- Indicators (RSI ~40-45, bearish MACD) show neutral-to-weak momentum without clear buyer control.
- Trading volume remains 15-20% below its average, suggesting a lack of conviction in price moves.
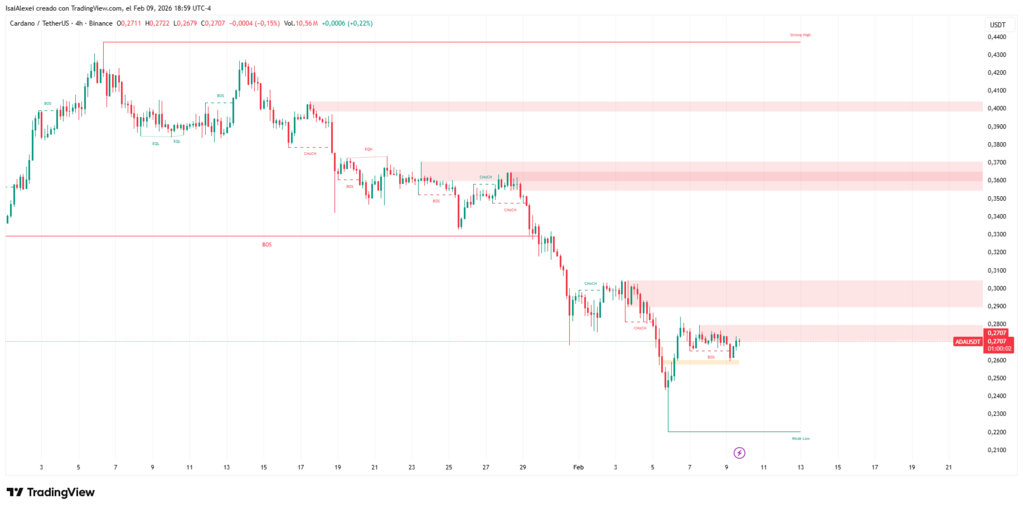
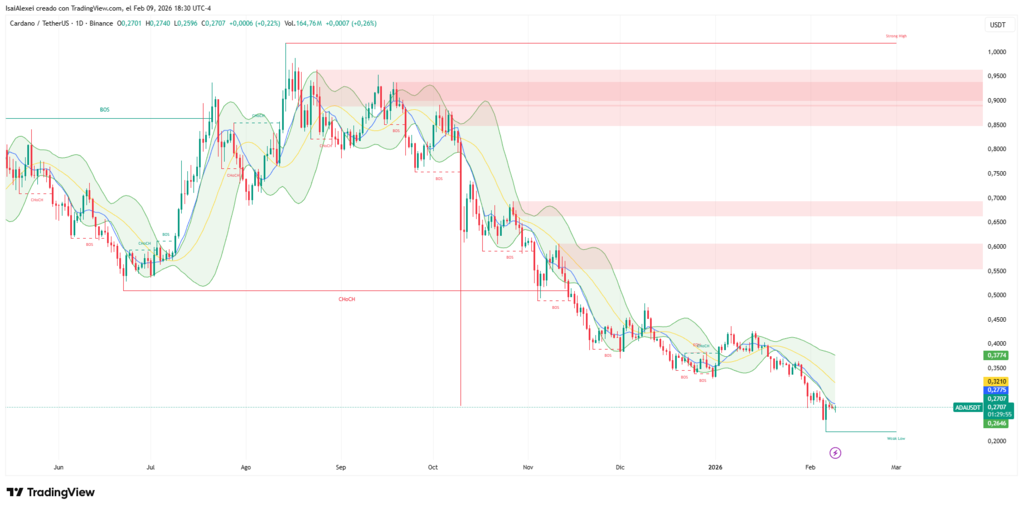
Cardano (ADA) closed the most recent session at $0.272 USD. ADA reached an intraday high of $0.274 and touched a low of $0.259. The price range reflects contained movements without a clear defined trend.
The current price sits below the 50, 100, and 200-period moving averages. When an asset trades below its main moving averages, technical analysts interpret it as a sign of selling pressure. The distance between price and averages indicates that buyers have not yet generated sufficient strength to change direction.
The RSI registers values near 40-45, a range that technically signals neutral territory with bias toward oversold conditions. Readings below 30 would suggest extreme oversold conditions, while values above 70 would indicate overbought territory. The current level shows that sellers lost intensity without buyers taking control.
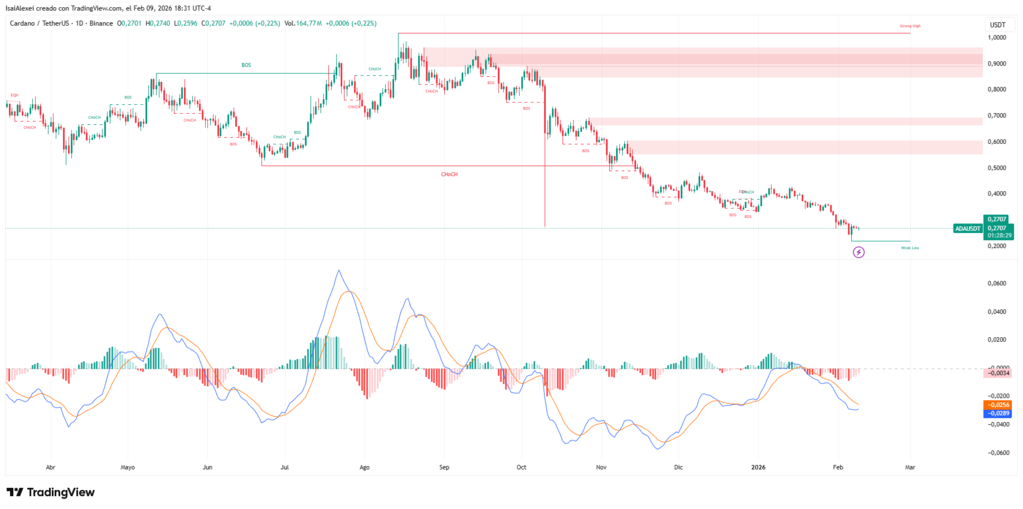
The MACD maintains an active bearish crossover. The signal line remains above the MACD line, a configuration that traders associate with negative momentum. The histogram shows red bars, confirming absence of bullish impulse.
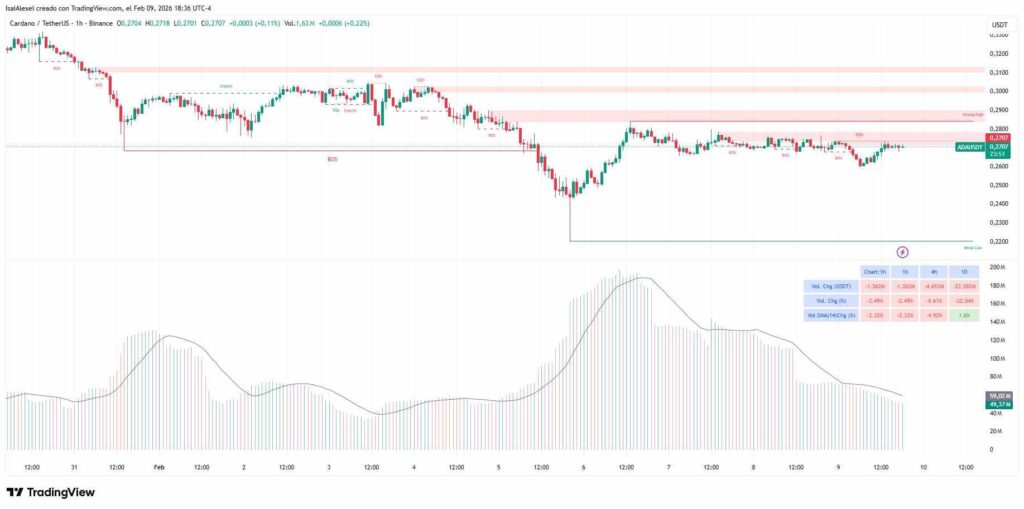
Trading volumes stay 15-20% below the 30-day moving average. Price movements with low volume tend to lack conviction. Sustained recoveries generally require volume increases that confirm real participation from institutional and retail buyers.
Support and resistance levels mark operational zones
Immediate support operates between $0.265 and $0.27. The price tested the $0.265 zone multiple times during recent weeks. Confirmed breaks below $0.265 would activate the next support at $0.24-$0.25. Additional declines would take the price toward $0.19-$0.20, a level that acted as a base during previous 2024 corrections.
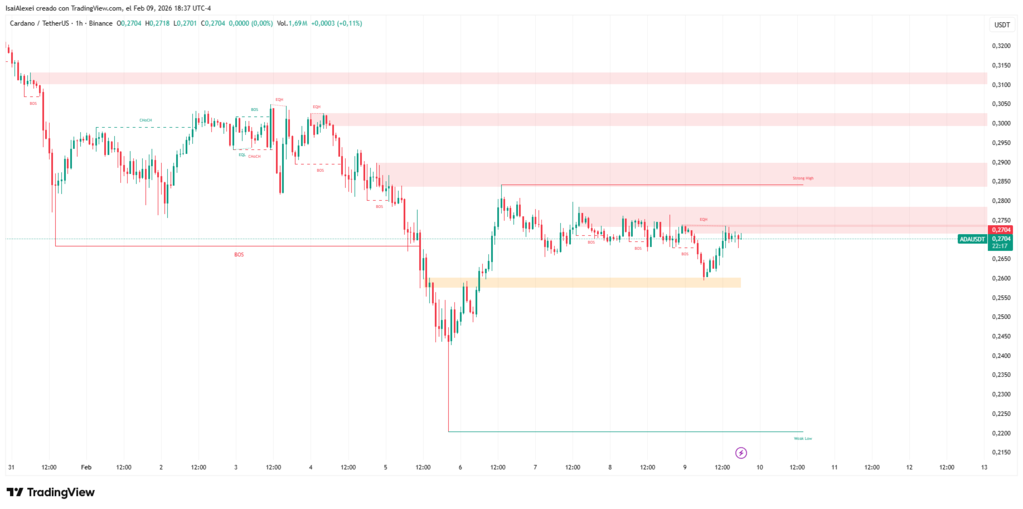
The main resistance stands at $0.28-$0.29. The price rejected attempts to surpass $0.29 on three occasions during January. The $0.30-$0.31 barrier represents a psychological level where technical resistances and price averages converge. Breaking above $0.35-$0.40 would require considerable volume and changes in market structure.
Professional traders observe breaks above $0.30 with volume 30-40% above average as a potential signal of trend change. Without volume confirmation, movements above resistances tend to reverse quickly.

The crypto market shows 70-75% correlation with Bitcoin in recent weeks. Abrupt movements in BTC generate similar reactions in major altcoins like Cardano. Macro factors such as central bank decisions or employment data in the United States also affect crypto prices.
Lateral consolidation phases typically last 4-8 weeks in absence of catalysts. Cardano operates in sideways range since mid-January, behavior consistent with markets waiting for clear direction.
The current technical outlook shows an asset without defined trend. The price needs to break above $0.30 with volume to change the prevailing bearish structure.