Bitcoin advanced approximately 24% during the week ending August 23, registering its largest weekly nominal gain since 2023. This movement lifted the asset from the $64,000 zone to a brief intraday peak of $81,265 on August 25, a level not recorded since May 2026. At the time of this writing, Bitcoin retraced to the $78,500–$79,000 range, reflecting a 2% decline from the weekly high.
The structural question for market participants is not whether the bullish bias has dissipated—the available data indicates its persistence—but rather the maximum attainable price in the immediate horizon and the conditions required to sustain that advance. The response, derived from a technical and on-chain examination, converges on a relatively narrow price band: $82,000–$83,000.

On-Chain Indicators: Regime Change Remains Unconfirmed
CryptoQuant elevated its Bull Score from 30 to 80 within a single week, marking the highest reading since October 6, 2025. Eight of the ten components comprising the index are currently in bullish territory. Spot demand is expanding at its fastest monthly rate since December 2025. More importantly, spot and futures demand are expanding simultaneously for the first time since October 2025.
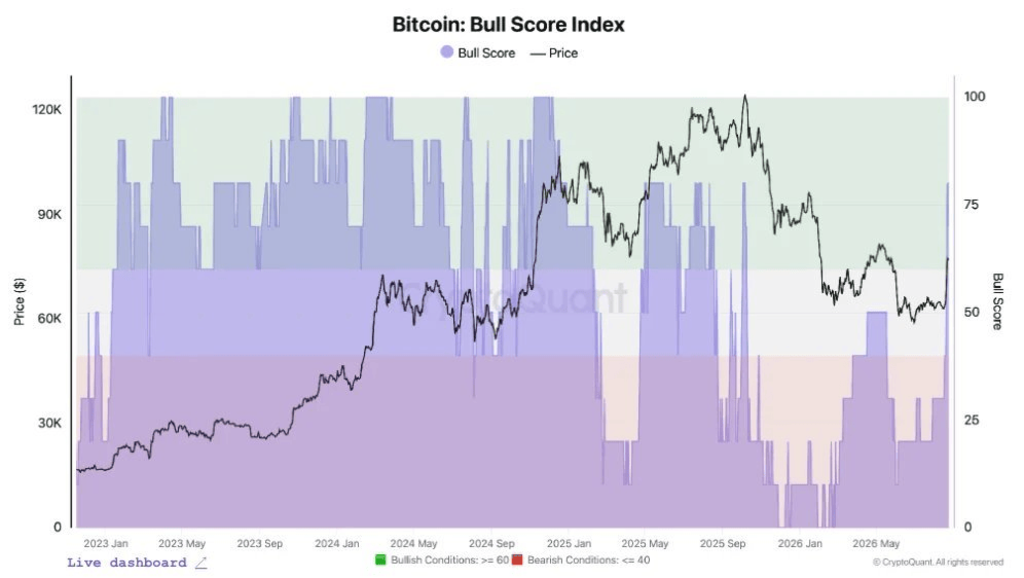
This simultaneity is relevant because it decouples the current movement from a rally driven exclusively by speculative leverage. When futures demand increases without spot market corroboration, the probability of a cascading liquidation event rises. Concurrent expansion suggests a broader buyer base, including participants settling positions with underlying assets.
However, the CryptoQuant framework introduces a restrictive condition: Bitcoin requires a weekly close above the 365-day moving average, currently positioned near $83,000. Without this close, the regime change remains formally unconfirmed. This distinction carries operational weight: the Bull Score measures the breadth and direction of underlying indicators, but the price level that structurally validates the movement lies approximately 5% above the current spot price.
A Technical Multiple, Not a Singular Ceiling
The rejection observed near $81,000 does not constitute an isolated profit-taking event. It coincides with the 50-week moving average, which at the time of rejection rested near $81,085. This level, combined with the May 2026 high of $82,814, forms a resistance zone between $81,000 and $83,000, rather than a single barrier at an exact price point.
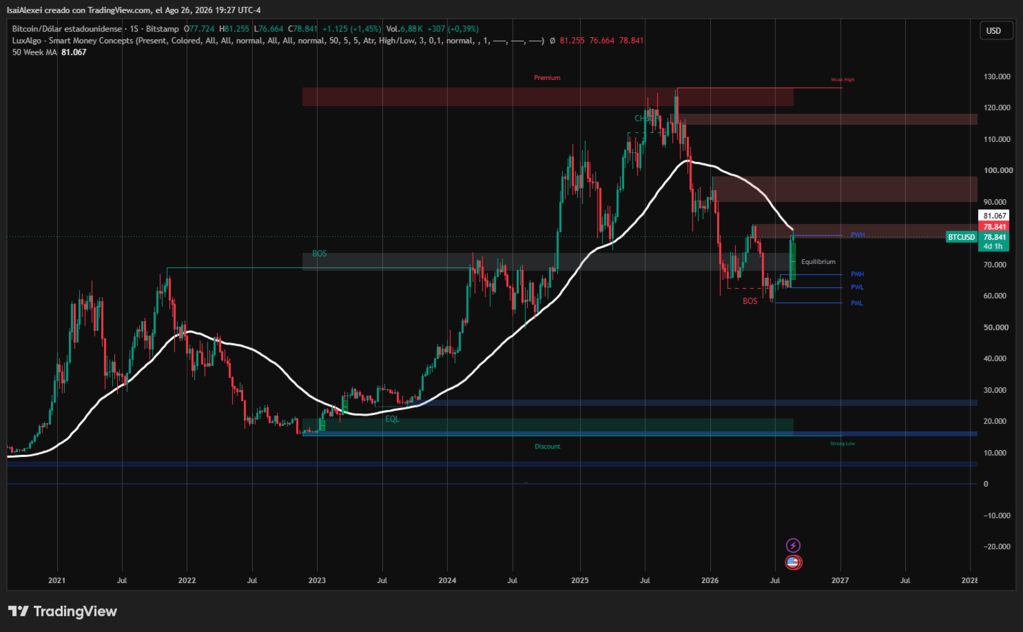
From a technical perspective, the 50-week moving average carries historical weight: in 11 of 13 prior instances associated with the conclusion of Bitcoin bear markets, the market floor had already formed when the asset recovered this level. Nevertheless, an intraday move above the average does not constitute confirmation. Technical operators require a convincing weekly close above the 50-week moving average, supported by evidence that the level can hold as support.
The $82,000–$83,000 band therefore represents the most relevant near-term confirmation threshold. A weekly close above this zone would validate the bullish structure and open the path to higher targets. Failure to close above this zone maintains the asset in a consolidation or corrective scenario.
ETF Flows: Sustained Institutional Demand with Contextual Nuance
US spot Bitcoin ETFs recorded seven consecutive days of net inflows, accumulating $3.03 billion in August with four trading sessions remaining in the month. The week ending August 21 concentrated $1.92 billion in inflows, the highest weekly figure since October 2025. BlackRock’s IBIT led the flows with approximately $1.33 billion over five consecutive days.
The cumulative net inflows for 2026 remain negative by $2.26 billion following the substantial outflows of June ($4.51 billion) and May ($2.43 billion). August represents the best month of the year in terms of inflows, but it has not reversed the annual balance. Institutional demand is improving, yet the accumulated flow indicates that capital has not fully recovered the ground lost in preceding months.
Macroeconomic Factors: Liquidity and the Debasement Trade
The immediate catalyst for the rally was the August 19 announcement by the US Treasury, which doubled the maximum size of its long-term bond buybacks from $2 billion to $4 billion per operation. This measure, effective from September 9 through early November, aims to provide liquidity support in market segments where trading had diminished.
First, Treasury Secretary Scott Bessent indicated the possibility of financing these buybacks from the Treasury’s cash account at the Federal Reserve, which stands at approximately $1 trillion. Reducing this balance transfers cash from the government to the banking system, adding liquidity to markets. Second, the intervention signals Washington’s willingness to contain borrowing costs, which investors interpret as a commitment to looser financial conditions.
The DXY index fell to near a three-month low, reaching 98.94 on August 20. This combination—liquidity expansion and dollar weakness—has reactivated the “debasement trade”: the rotation toward non-sovereign assets such as Bitcoin and gold, perceived as hedges against fiat currency devaluation.
The Federal Reserve maintained its federal funds target range at 3.50%–3.75% in its July 29 meeting, with three policymakers advocating for a 25-basis-point increase. Inflation remains above the 2% target. Treasury buybacks constitute a swap of long-term debt for short-term debt, not a direct injection of new money into the system. The effect on Bitcoin is partially psychological and expectations-driven, rather than purely monetary.
Three short-term risk metrics have activated during this rally. The trader unrealized profit margin reached 20.5%, its highest level since June 2025. Whales realized a record $614 million in profits on August 20. Exchange inflows for BTC, ETH, and XRP have increased, suggesting potential selling pressure in the near term.
They are characteristic of rapid rallies. However, they raise the threshold for continuation in the very short term. An unrealized profit margin of 20.5% measures the average paper gain of market participants. When that margin extends, the incentive to sell increases. The record profit-taking by whales demonstrates that larger holders did not wait for confirmation at $83,000; they sold into strength.
Institutional Projections: Consensus at $100,000–$125,000 for End-2026
Bernstein, in a note published August 26, projects Bitcoin reaching $125,000 by the end of 2026 under its base and bullish scenarios. Its base case places Bitcoin at $150,000 by mid-2027 and $300,000 at the 2029 cycle peak; its bullish case raises these figures to $200,000 and $500,000, respectively. The firm maintains a long-term target of approximately $1 million for 2033 in both scenarios.
Standard Chartered maintains a year-end 2026 target of $100,000. Additional analysts, including former Coinbase Head of Institutional Research David Duong, project Bitcoin surpassing $100,000 before the end of 2026.
Bernstein’s argument rests on two pillars: First, the structural reduction in drawdown depth in this cycle: the approximate 50% decline from the October 2025 peak is shallower than the 75%–90% retracements observed in prior cycles. Second, the increased institutional and corporate participation provides downside support that was previously absent.
Bias Persists, but Confirmation Has a Defined Price
On-chain indicators, ETF flows, and macroeconomic conditions have improved significantly over the past two weeks. The CryptoQuant Bull Score, the simultaneous expansion of spot and futures demand, and the strongest ETF inflows since October 2025 collectively point toward a potential regime change.
However, this change remains formally unconfirmed until Bitcoin registers a weekly close above $83,000 (the 365-day moving average). The rejection at $81,000 and the presence of a resistance zone between $81,000 and $83,000—incorporating the 50-week moving average and the May 2026 high—define the immediate technical ceiling.
The question of “how high it can go” therefore admits two distinct responses. In the confirmation scenario—a weekly close above $83,000—the path toward the $100,000–$125,000 projections outlined by Bernstein and Standard Chartered becomes technically viable. In the sustained rejection scenario at this zone, the asset will likely consolidate within the $76,000–$78,000 range, with a downside risk toward the $71,800 zone if support breaks.
The bullish bias remains active, but the price of its confirmation has become narrower and more clearly defined than in previous weeks. The market has reached an inflection point where the directional outcome will be determined within a range of approximately $2,000–$3,000. Surpassing or failing to surpass this band will determine, in the near term, whether this advance constitutes a relief rally or the inception of a new cyclical uptrend.