
TL;DR
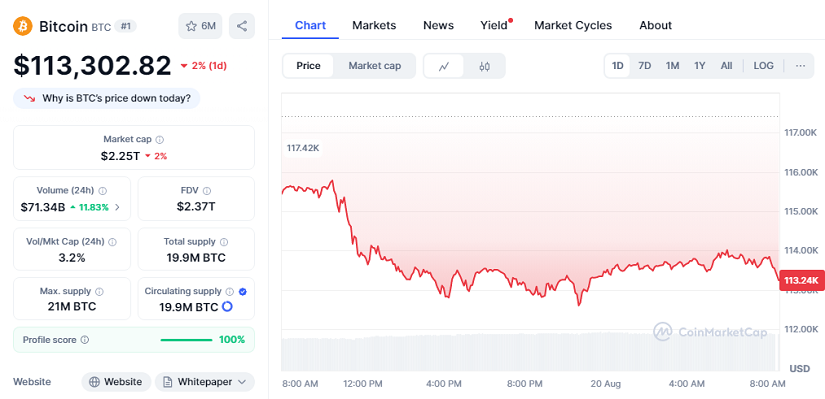
- Bitcoin has dropped to $113,302.82, marking a 17-day low and fueling strong bearish sentiment among retail traders.
- Market data shows the asset down 2% in the last 24 hours, with a capitalization of $2.25 trillion and trading volume of $71.34 billion, up 11.83%.
- Analysts point out that despite the panic selling, institutional investors are quietly accumulating, hinting that this correction may be a healthy phase before another rally.
Bitcoin retraced sharply on Tuesday evening, hitting $112,600 before stabilizing near $113,302.82. The decline marks an 8.5% drop from last week’s record above $124,000. The downturn has pushed the Bitcoin Fear & Greed Index to 44, indicating “Fear,” its lowest reading since late June. Retail investors, who were optimistic only days ago, now reflect what Santiment calls “ultra bearish” sentiment, the most negative outlook since June 22.

The wider cryptocurrency market also reacted, with total capitalization slipping below $4 trillion, reaching a two-week low. However, many pro-crypto analysts stress that corrections during bull cycles often provide buying opportunities rather than signal trend reversals. Experienced traders often view these pullbacks as chances to accumulate at discounted levels, positioning themselves for the next leg higher.
Historical Perspective On Market Corrections
Market pullbacks are not unusual in prolonged uptrends. In 2017, Bitcoin dropped 36% in September before rallying to fresh highs by December. A similar move occurred in 2021, when BTC corrected 23% and then powered to a record later that year. Some analysts believe that if the current cycle mirrors history, Bitcoin could fall closer to $90,000 next month before resuming its path toward new highs.
Santiment analysts emphasize that extreme bearish sentiment is often a contrarian indicator. Markets, they argue, tend to move in the opposite direction of the crowd’s expectations, making widespread panic selling an early signal for a potential rebound in the weeks ahead.
Technical Analysis Signals Key Levels
From a technical perspective, Bitcoin has slipped below its 50-day Simple Moving Average at $115,870, which now acts as resistance. A head-and-shoulders pattern has formed with neckline support near $112,000. A break below that level could push BTC toward $108,000 or $105,150, levels that many traders are closely watching.
Despite near-term risks, long-term charts still show higher lows since June. Institutional players such as Metaplanet and Strategy continue to accumulate during dips, reinforcing the view that the current phase represents accumulation rather than capitulation.
At press time, Bitcoin trades at $113,302.82, down 2% in 24 hours, with a $2.25 trillion market cap and $71.34 billion in trading volume.