
This last week the market has undoubtedly been very hectic, in this technical analysis of prices we bring you a summary of what happened. The bulls regained absolute control of the war and managed to make the bears move back a lot of ground, to areas that a few days ago were completely unsuspected.
On Monday 16, began the strong onslaught of the bulls in which they showed their enormous strength, by making the market move in the direction that most people desired, but the least expected for many analysts.
For more than a week, the price remained in a laterality of which we are obviously aware, so the most likely is that the same horizontality in the price should have been maintained for a little longer, but often the market teaches us that which most likely is not always the safest or most accurate, so you always have to consider both possibilities when operating in the financial markets.
Right now there is a very curious situation in which alternative currencies (also called Altcoins) in general are falling in price, while bitcoin is doing the opposite. This situation of obvious lack of harmony, is curious, at least.
And it can be explained from several perspectives, but one of them is that most of the capital that entered the market went to Bitcoin but not to Altcoins, so we only see the force in the first currency, but not in the other.
This is a sign that, bit by bit, alternative currencies unravel from bitcoin as the market evolves, which is good news per se in the long term. Thus, let’s see a brief technical price analysis of the first 10 coins in capitalization according to CoinMarketCap.
Bitcoin BTC/USD
The impression is an emotion that we felt very strong during these last weeks, first during the prominent attack and subsequent advance of the bears, when the market managed to make a new absolute minimum around the $ 5,800; and then during the recovery of control by the bulls, a situation in which we still find ourselves today, which has generated many interesting perspectives.
The fact that bears give control to the bulls in a brusque but predictable way is an important part of the dynamics that create the market. It is informative to know that during this week, the advance of the bulls managed to break the laterality in the area of $ 6,800, an area in which there was great pressure on the sale that gave the advantage to the bears, even though, the bulls managed to make an impressive advance and then continue conquering other areas, such as $ 7,000 and $ 7,500; to right now where it stands around the $ 7,800, an amount that is a thousand dollars higher than the $ 6,800 mentioned above.
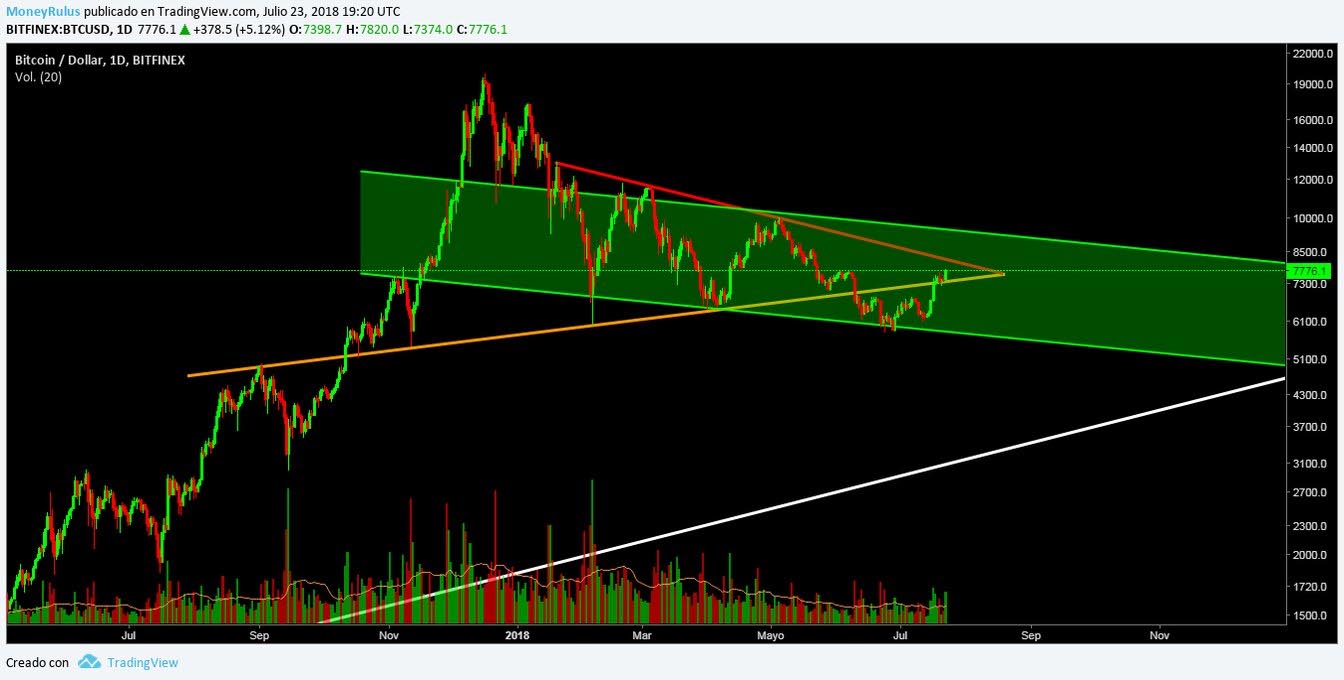
Observing the BTC/USD pair in the BitFinex exchange house, we note that the price is within the ascending channel – green – medium term, this is something that indicates that although the bulls are showing a lot of power, the downward trend is still standing, something that is definitely important to remember. It is possible that the price continues to be directed towards the upper part of the channel, so that this area can be constituted as a future value resistance.
For its part, the long-term bull trend line – orange – has been broken while acting as a resistance, so now it is established as a header support, it is interesting to see that the price seems to be heading towards the bearish trend line – red – medium term, the same at this time is a resistance to the support that establishes the orange line, they create the contractive laterality that is seen in the graph in a triangular form.
The price seems to be using the orange trend line as a support to push towards the resistance of the red trend line. In case the red trend line gives way, the possibility that the price goes to the upper part of the green channel, would be very high.
The volume has shown an interesting increase these past days, the strength has been greater than in recent weeks we have been accustomed, no doubt this may be a good sign for the bulls. Although on the other hand, it is important to remember that now is where the war begins.
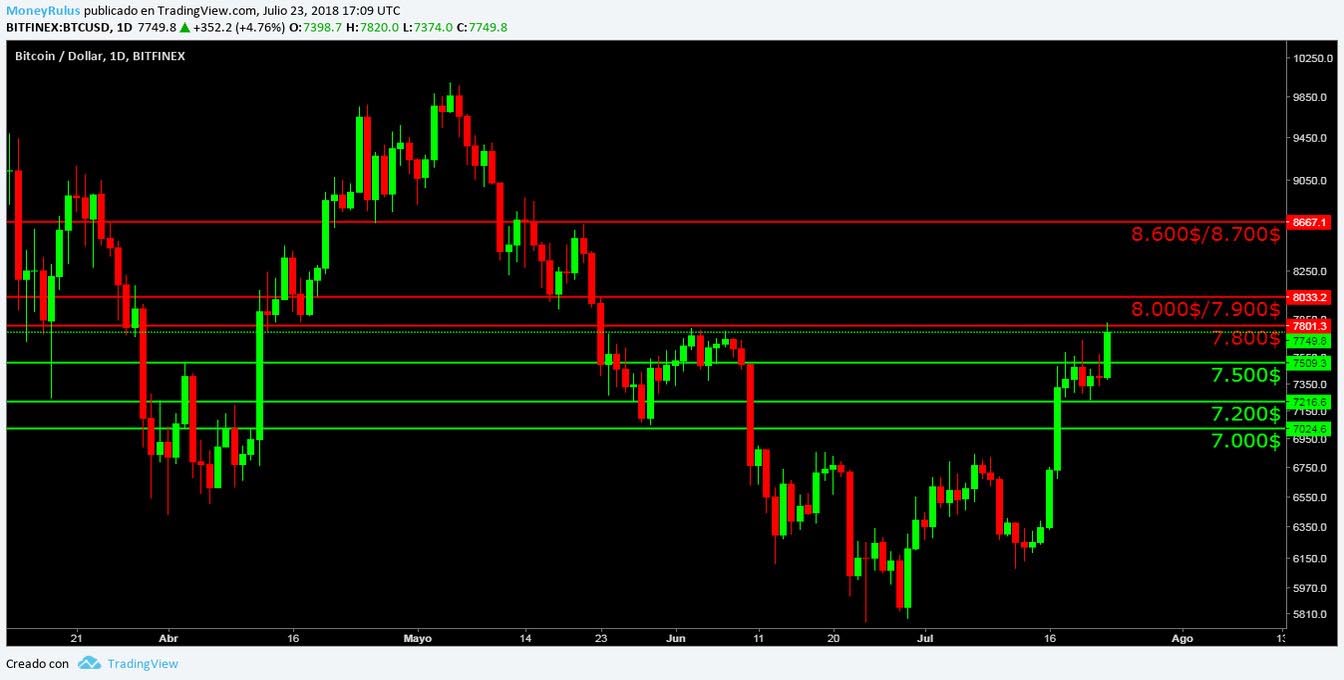
The bears can make a great effort to create resistances in the $ 7,800, $ 8,000 / $ 7,900 and $ 8,600 / $ 8,700 areas.
While the bulls, having conquered several areas during the week, have created supports in the old resistances of $ 7,500, $ 7,200 and $ 7,000.
Ethereum ETH/USD
Ethereum, being the second currency with the highest market capitalization, is the first divergent we find. Knowing that BTC had an impressive week in which the bulls regained control that they had lost a while ago, and that the bears could only see and stay still before the overwhelming strength of the bulls, something similar would be expected in the second currency of the market.
But just by looking at the quotes over the past few days, we noticed that Ethereum is not imitating everything bitcoin has done, which is undoubtedly something really unusual. What happens is that quite possibly a large part of the capital was concentrated in the first currency (bitcoin), so many of the other currencies were ignored by investors, therefore they did not receive a large amount of capital. In addition to the sales made by many investors, it causes many currencies to be in the red, while BTC does the opposite.
On the one hand it can be seen as something negative, but it seems to us that this is a clear sign that, little by little, alternative currencies are becoming independent from the main currency, Bitcoin.
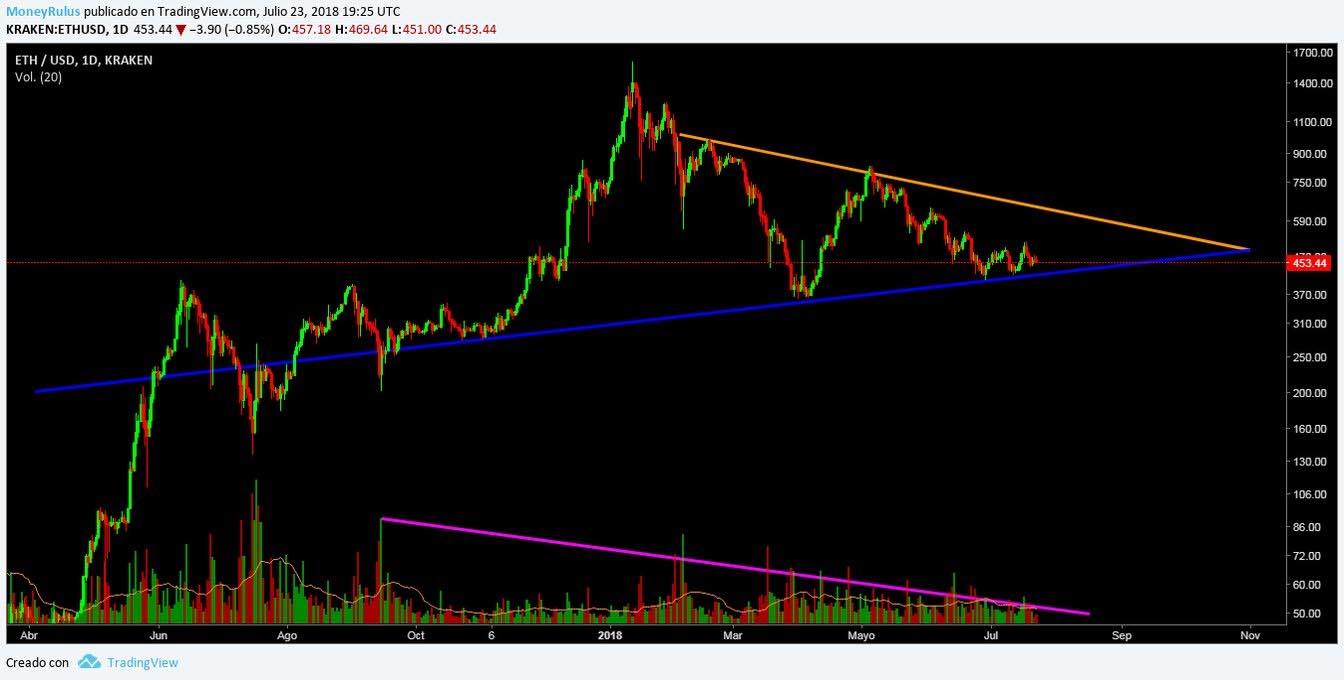
In the ETH / USD pair at the Kraken exchange house, we observe that the price has remained above the support that constitutes the uptrend line – blue – long term, this line has been a constant support throughout the months , it has already served as a ground several times and the more times it does it, the stronger it will be.
Something remarkable is that despite the fact that the price has stayed on the blue trend line, it has not made any major movements, but has only been dedicated to making small rebounds that for a time seem to move it away from the blue trend line, but then go back to it.
The medium-term downtrend line – orange – still remains a distant target on the horizon, but that does not mean that it is not reachable, since this week bitcoin has shown us that this is completely possible, the orange trend line tendency acts as a strong resistance, so in that area bears can try to take control, we just wait to see if they succeed. Unlike Bitcoin, Ethereum did not increase in volume much this week, the force that it showed is even lower than last week, so it is necessary to continue being very careful.
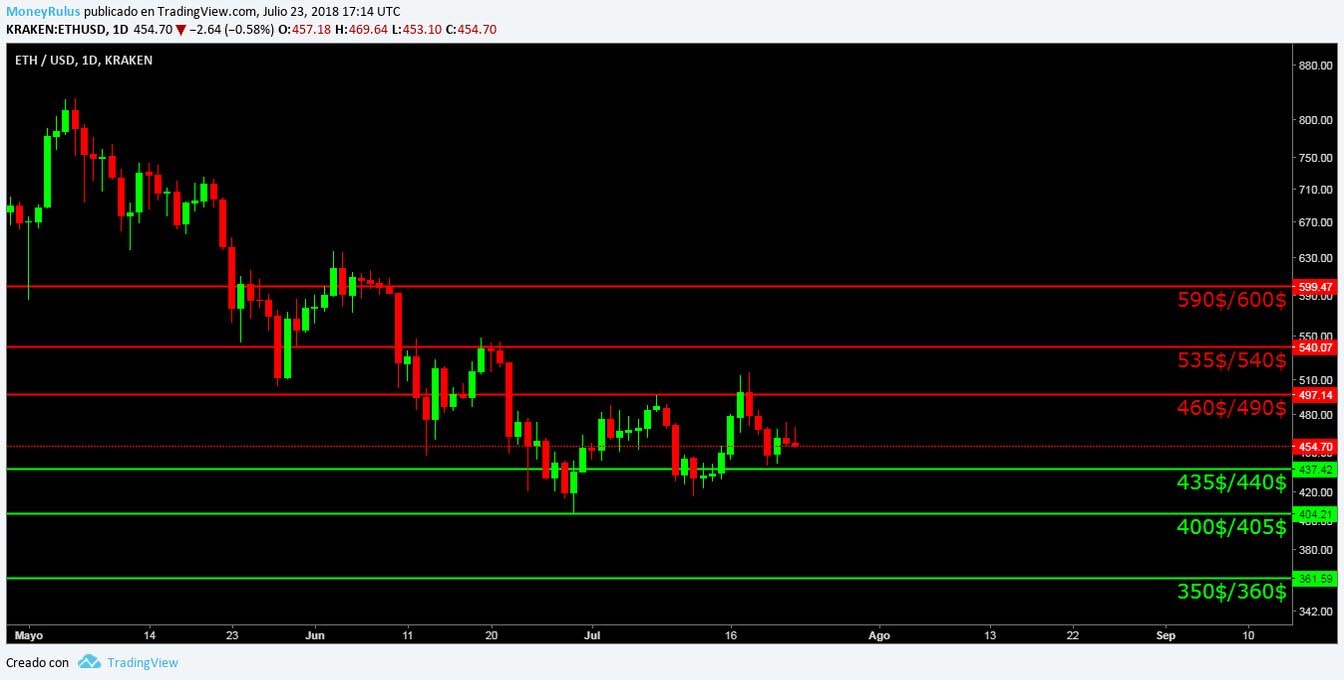
The bears can barricade themselves in the areas of $ 460 / $ 490, $ 535 / $ 540 and $ 590 / $ 600, to create resistances.
On the other hand, the bulls in their advance can form supports in the $ 435 / $ 440, $ 400 / $ 405 and $ 350 / $ 360.
Ripple XRP/USD
The XRP / USD pair in theKraken exchange, shows how the price has been respecting the slightly descending channel – green – medium term, at the moment it is in the lower part of it, trying to bounce in the support that the bottom region of the channel constitutes.
If this support is respected, the price can be directed towards the upper part of the channel, in an attempt by the bulls to retake power. The fact that they respect this channel in the way they do, illustrates the fact that the bearish trend is still in process, something that is not advisable to ignore.
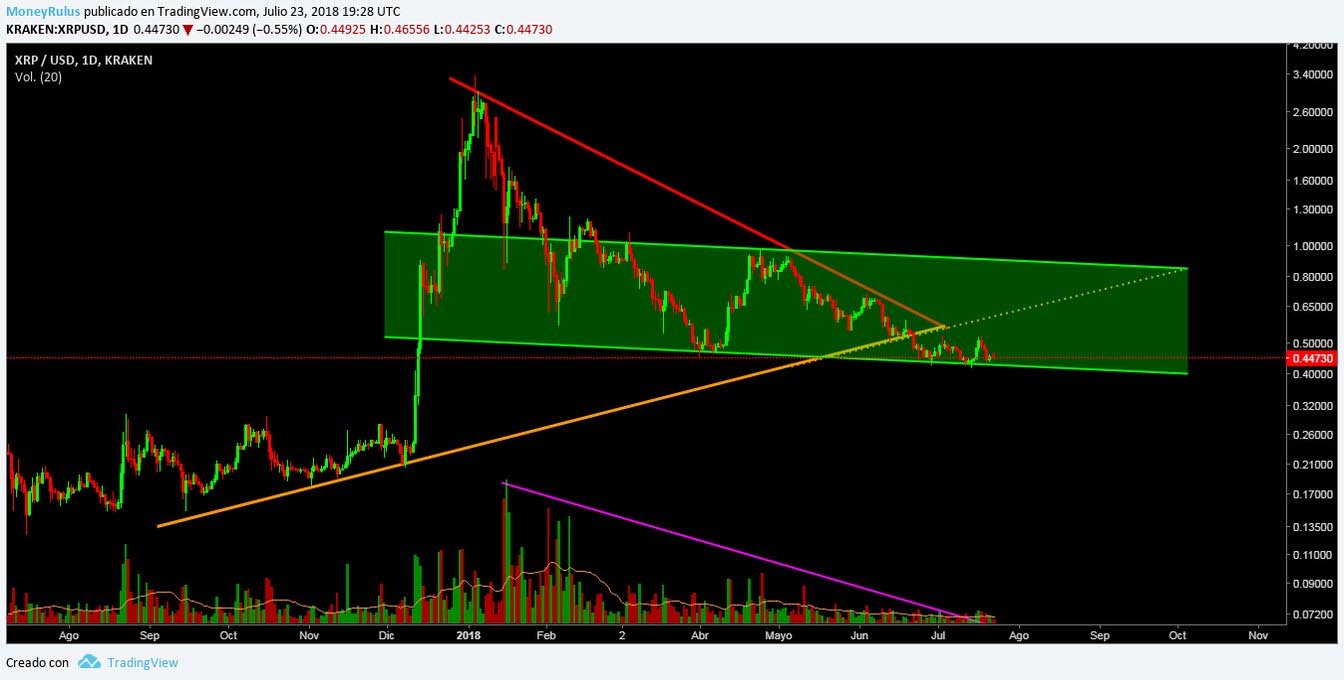
The price has not come close to the long-term bullish – orange – trend line, but if the bulls take control in a way that is remotely similar to what they did in BTC, this orange trend line could be a resistance to have into account.
Similarly, the price is far from the area, where the downtrend line – red – medium term is, and identifies itself as a resistance, however distant that area seems, the volatility of the market in which we develop tells us that in a very short time great changes can arise.
The volume this week, increased slightly compared to the volume during the previous week, this is a positive detail for the currency, since it has already a very low volume. This small increase in strength can be interpreted as a wake-up call from the bulls.
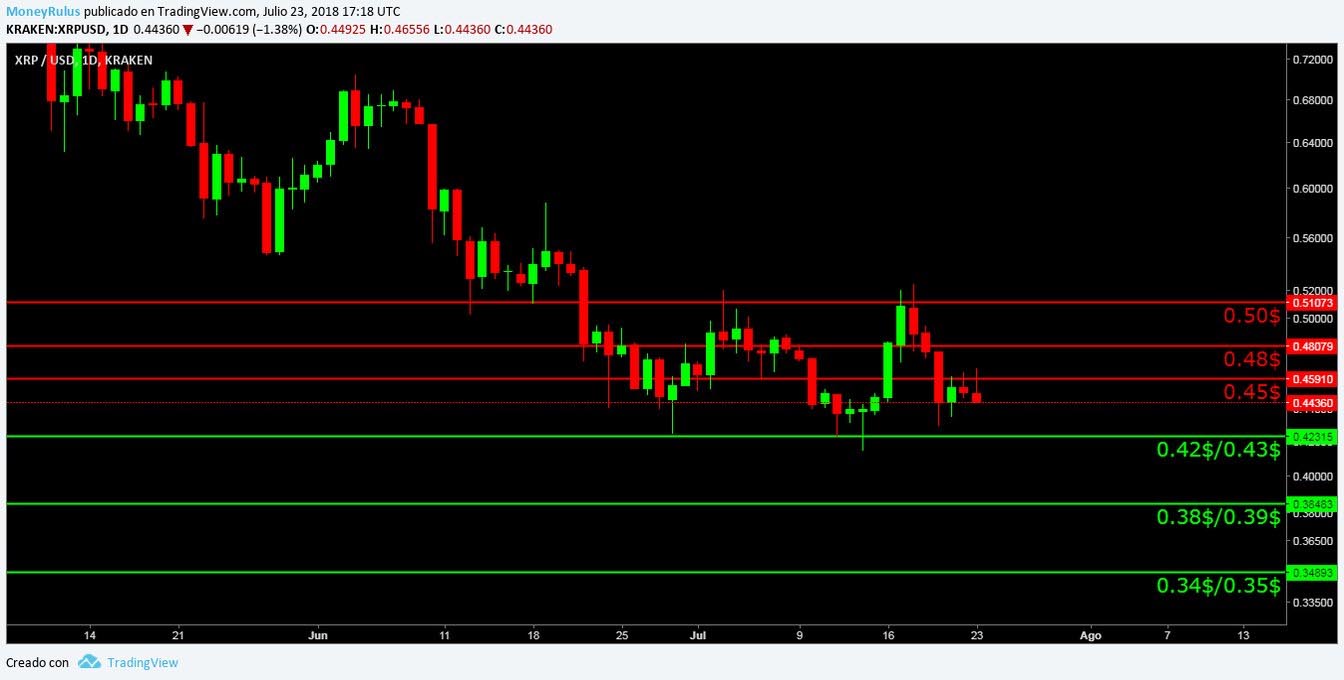
The bears remain firm in the possible resistance of 0.45 $, 0.48 $ and 0.50 $.
The bulls do the same and create supports in the areas of 0.42 $ / 0.43 $, 0.38 $ / 0.39 $ and 0.34 $ / 0.35 $.
Bitcoin Cash BCH / USD
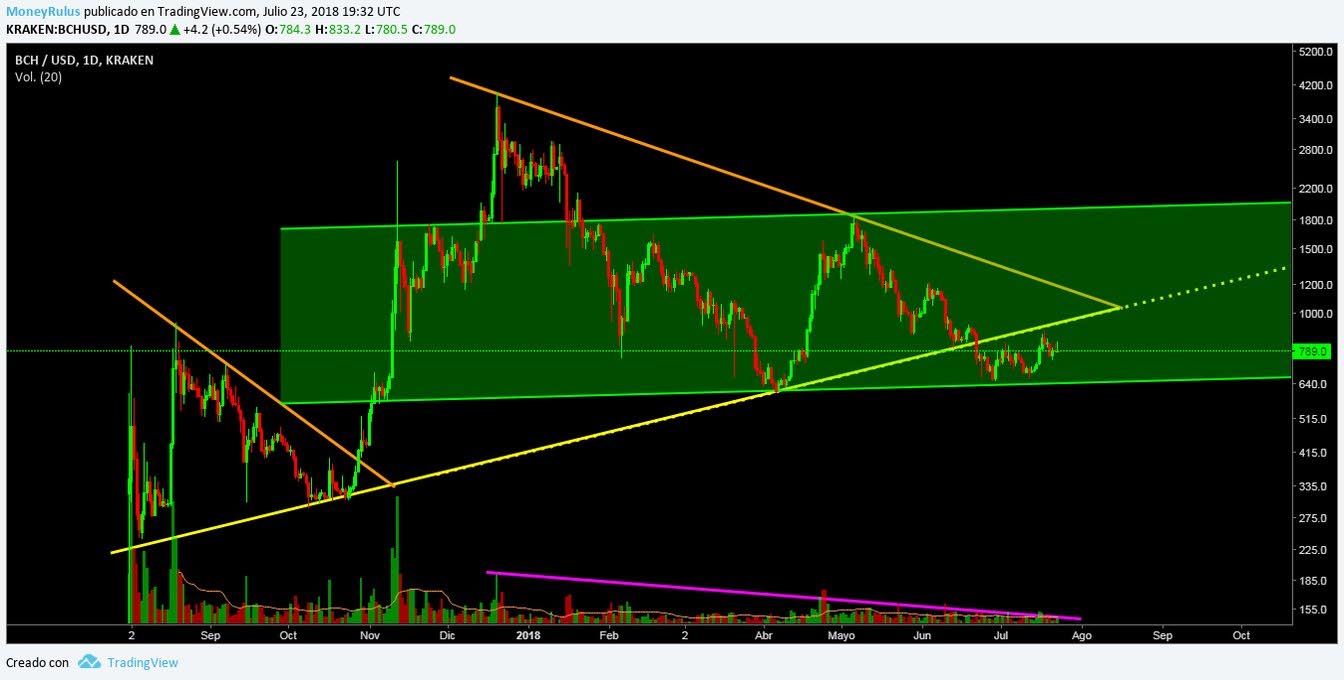
Perceiving the BCH / USD pair in the Kraken exchange house, we see that the price, as it is the case with XRP, is within a channel, in this case it is a slightly rising channel – green – medium term; at this moment the price seems to be heading towards the upper part of the channel, after having bounced about 3 weeks ago in the lower part.
The first resistance that must be beaten to follow that course, is the line of upward trend – yellow – long term, this area is presented as a possible ceiling, which one day was a support, in the case that the price manages to break it, it would become once again a support that could also become a potential ground in the future.
Should this happen, the medium-term downtrend line – orange – would be the next resistance to have in sight, this area has not been visited by the price for some time, so it may be that bears take advantage of that to create strong selling pressure.
If the price breaks the resistance of the yellow trend line, it would be within the triangular pattern we talked about a few weeks ago, in case this happens, all this descent could have been a trap for the bears. The fractal on the left reminds us of the potential of these types of triangular patterns.
The volume has remained stable during the week, neither increased nor decreased, this indicates that the currency market may be little moved or decapitalized, so undoubtedly an injection of capital that adds strength to the quotes, could be a very good wake up call.
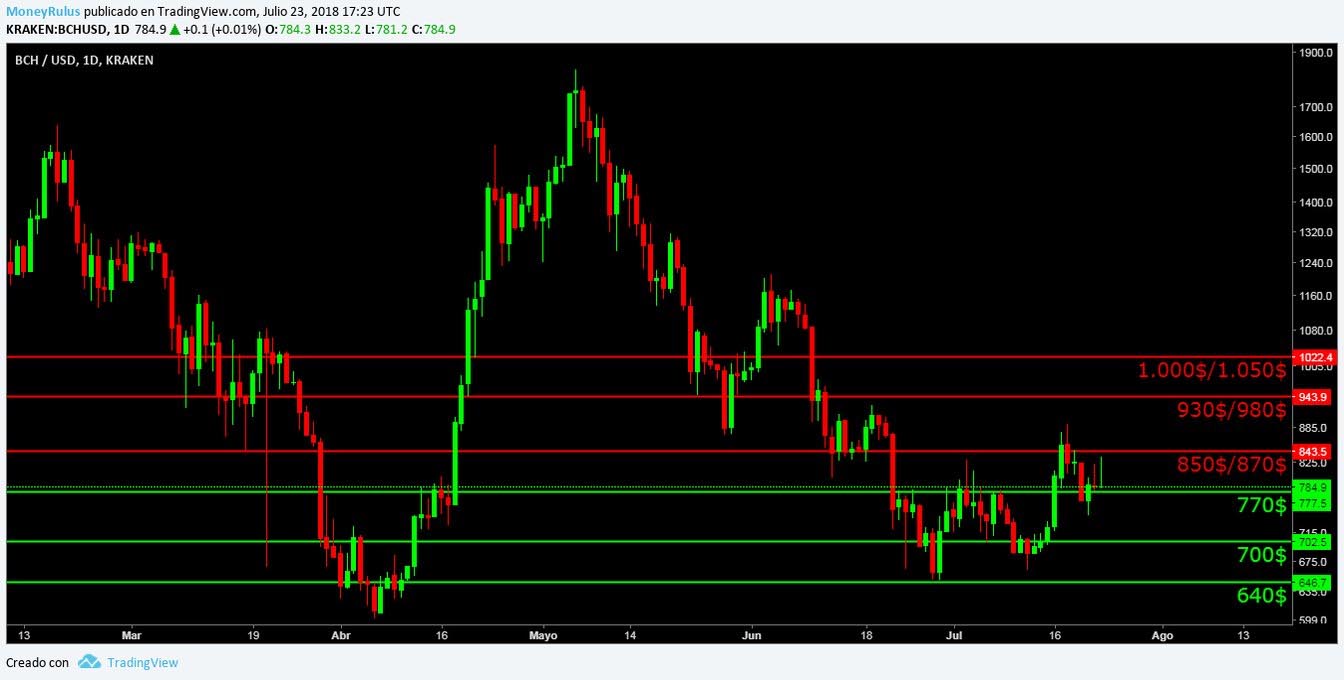
There may be resistances at $ 850 / $ 870, $ 930 / $ 980 and $ 1,000 / $ 1,050.
As well as supports could be presented in the areas of $ 770, $ 700 and $ 640.
EOS EOS/USD
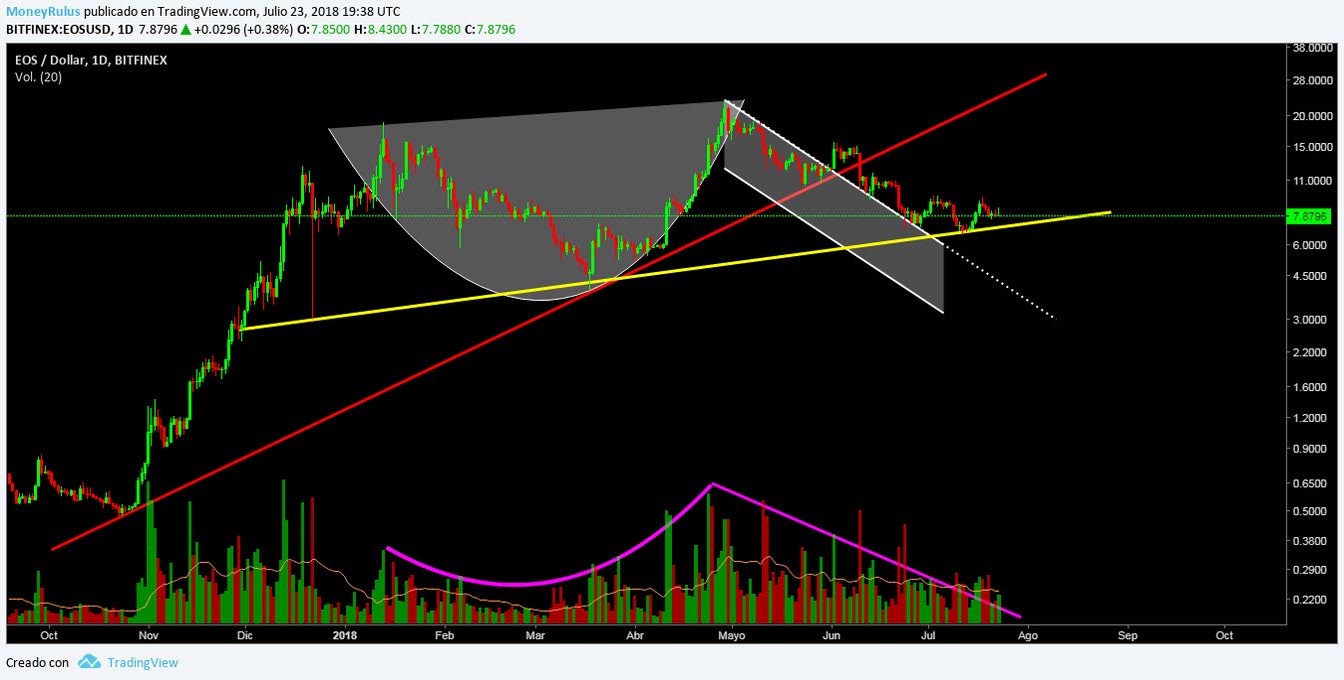
The pair EOS / USD in the BitFinex exchange house shows that the Cup & Handle pattern is still valid, in these moments the price remains in a neutral zone, enters the line of downtrend – white and dotted – short term that is an interesting support and it is formed by the upper part of the descending channel that forms the possible Handle and the long-term bullish-red trend line, which acts as a resistance.
Right in the neutral zone that we are talking about is where the medium term bullish – yellow – line appears, this line is a support at this moment, and has been respected for a few weeks, so from an immediate perspective , it can be useful.
If the price uses the yellow trend line as a support, it could be directed towards the resistance represented by the red trend line; and if it manages to break that resistance, the same zone would be used as a valued support.
The volume during this week increased slightly, so we can believe that some strength entered the coin. For its part, EOS is one of the few currencies that is in green numbers, this is a clear sign that investors are interested in it.
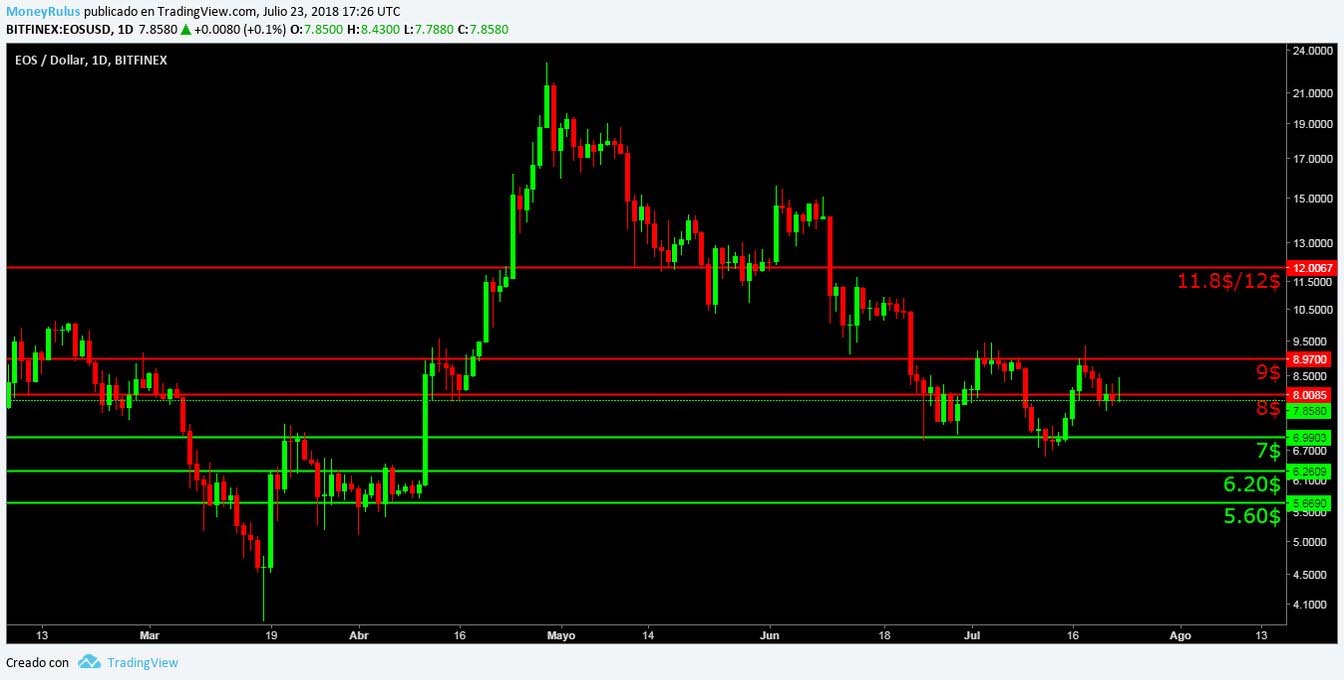
Bears can form resistances in the $ 8, $ 9 and $ 11.8 / $ 12 zones.
For their part, the bulls can create interesting supports in the $ 7, $ 6.20 and $ 5.60.
Litecoin LTC/USD
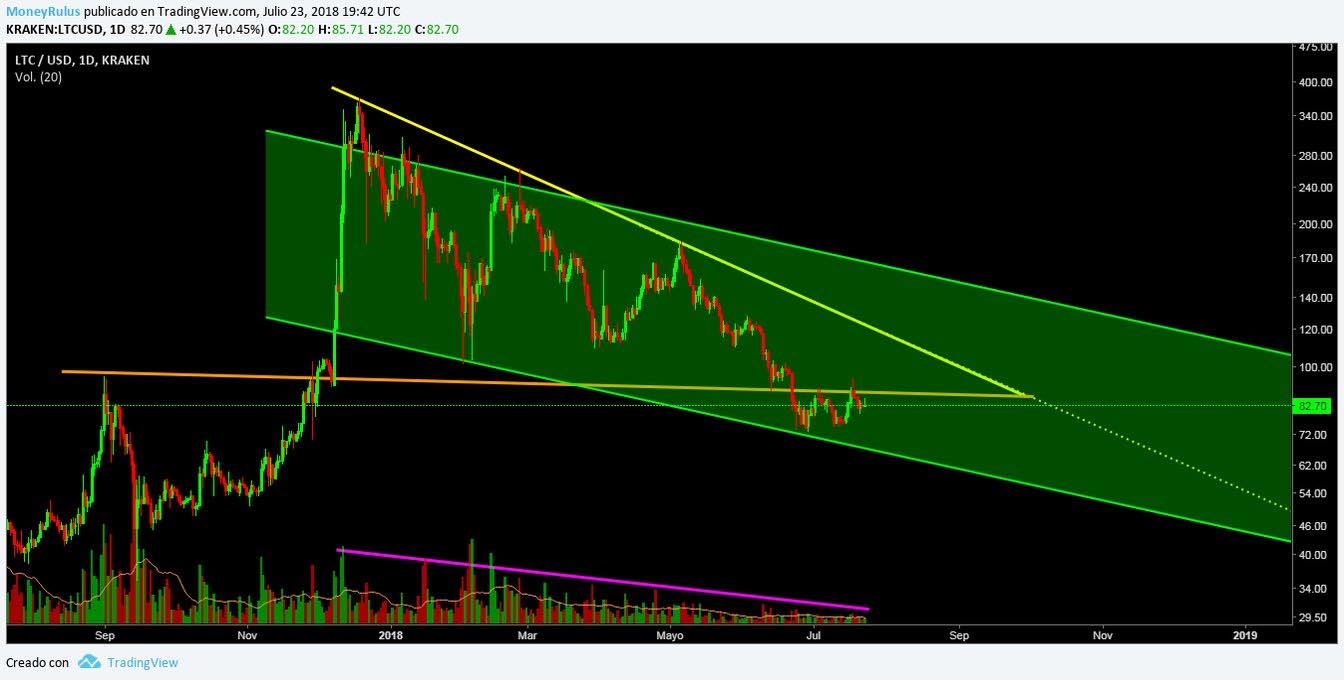
The LTC / USD pair in the Kraken exchange house shows that the price is within the descending channel – green – medium term, this channel for some weeks we have had it in mind, and so far it has served as support in the occasions in which the bear’s attack acquires strength, after having bounced in the lower part of the channel, it is possible that the price tends to the upper part of it, so that this area in the future could be a resistance to have into account.
At this moment, the price is towards a test in the long-term – orange – lateral trend line, which acts as a strong resistance since the price invalidated it as a support approximately 5 weeks ago.
On the other hand, there is the medium-term trend line – yellow – which is another resistance that may be important in the future. In case of breaking the upwards orange trend line, the price would be again within the triangular pattern that we already know, if that happens and expects to reach the upper part of the green channel, it will have to overcome the yellow upward trend line , to be able to advance towards its mission, because otherwise it will not be able to achieve it.
The volume is similar to last week, as if the market was exactly the same, this is the phenomenon that shocks many analysts, but we already know a potential reason. LTC is a currency of great importance in the ecosystem, so undoubtedly it is always a good idea to take it into account. Should it enter a greater strength, it would be a very positive signal, although the mere fact of remaining stable already indicates some interesting detail.
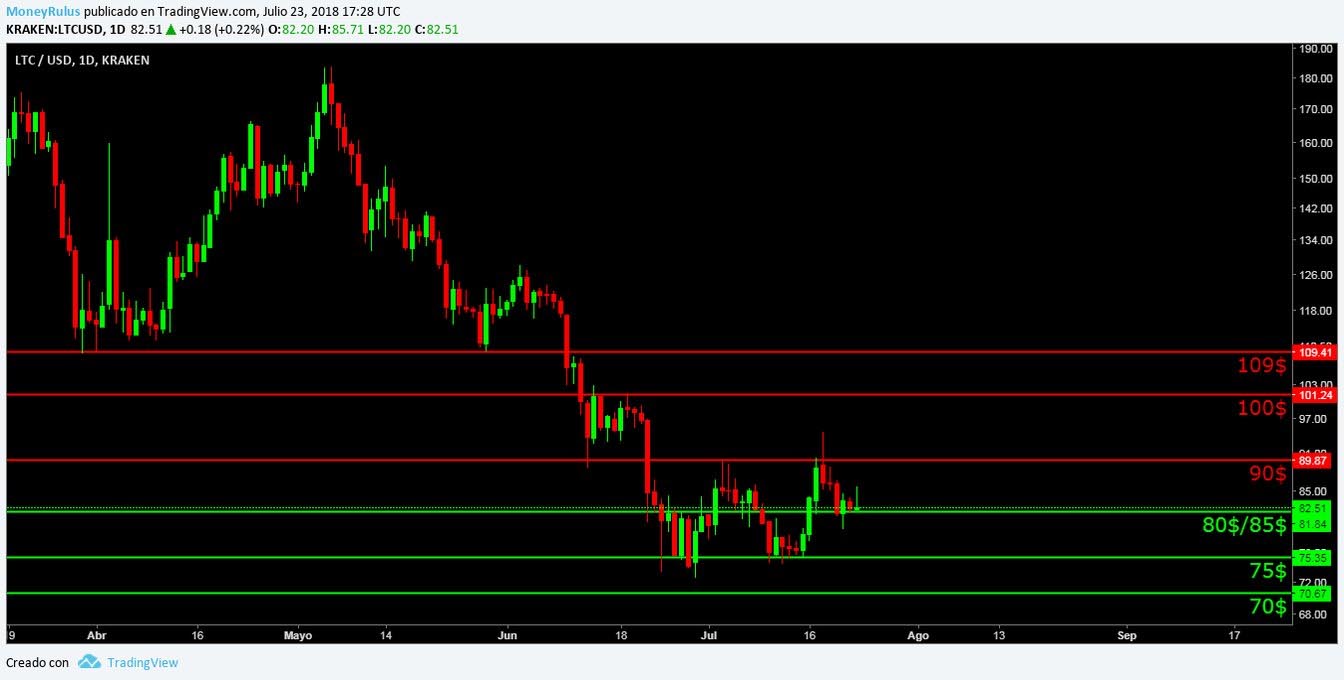
Bears can form potential resistances in the $ 90, $ 100 and $ 109.
The bulls can counteract these resistances, with supports in the areas of $ 80 / $ 85, $ 75 and $ 70.
Cardano ADA/USDT
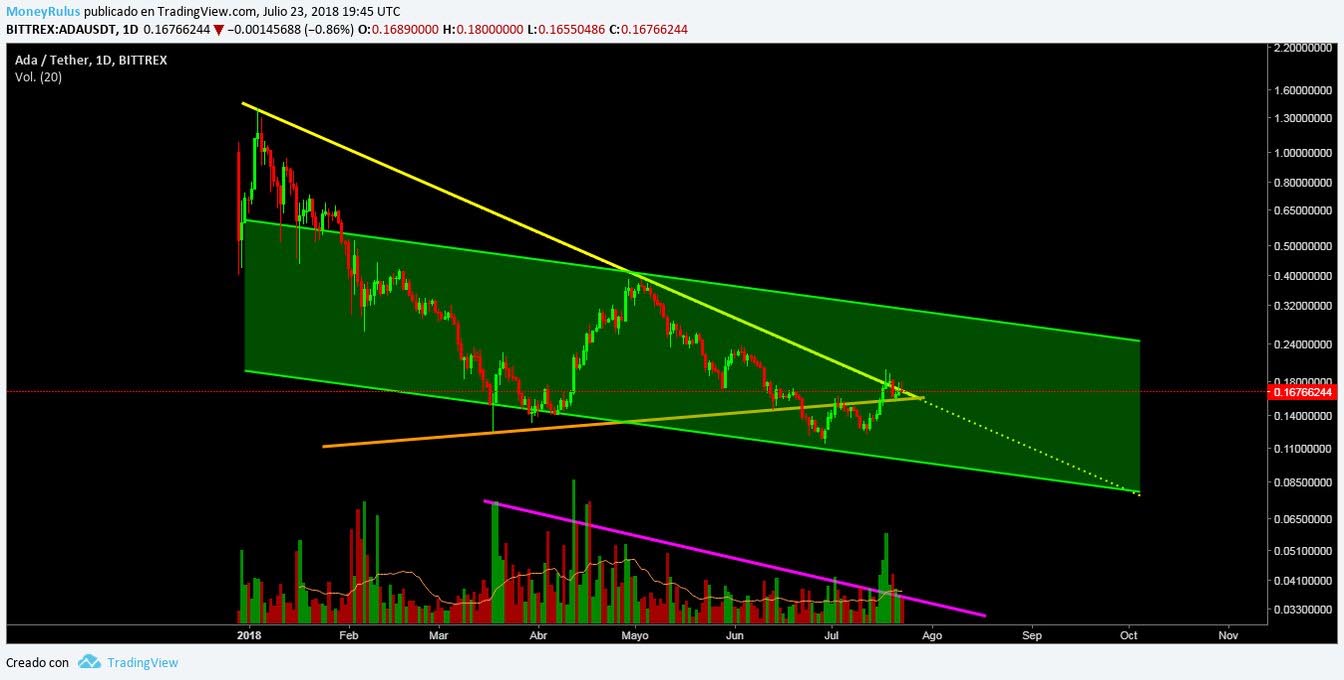
The ADA / USDT pair in the Bittrex exchange house exemplifies really interesting things, the price is within a descending channel – green – long term, at this time it is possible that after having bounced in the lower part of it, is heading to the upper part of the channel, an area that is a potential resistance, which is clearly reflected in the horizon of the bulls.
The price broke with a lot of force the upward trend line – orange – medium term, which served as a resistance, then it became a support, at this time the area could serve as a ground in case the bears take control of the currency, but that for now does not seem very likely.
The descending trend line – yellow – long term, remains valid and is being tested as a strong resistance, if the price breaks it, it could become an important support. At this moment, the price is lateral, contracted between the yellow and orange trend line, depending on which trend line it decides to respect and which one invalidate, we will have an idea of where the market is headed and where it is not going.
In order to reach the upper part of the green channel, it is necessary to break this zone, so at this moment, everything will depend on that. The volume during the week increased a lot, a clear signal that there is strength in this currency. The interest of investors is a clear confirmation of the importance of ADA in the market. Few coins retain such a level of strength.
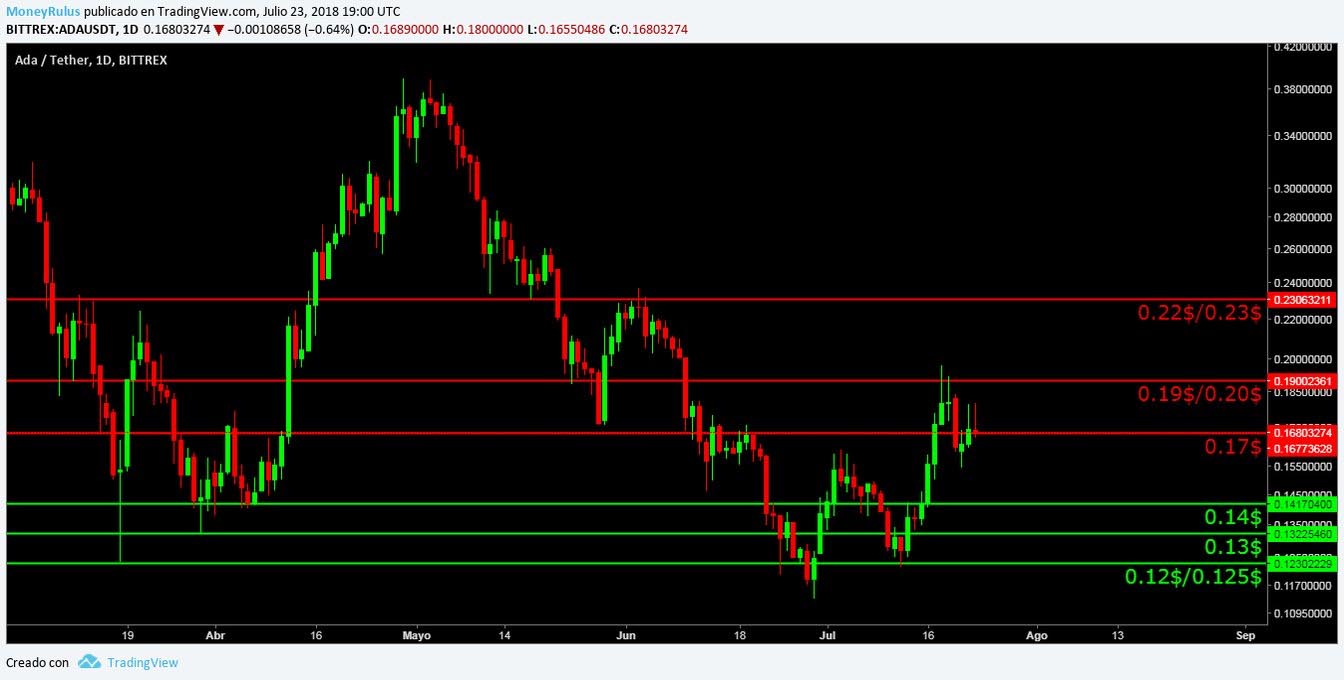
The bears can establish resistance in the areas of 0.17 $, 0.19 $ / 0.20 $ and 0.22 $ / 0.23 $.
Bulls can create supports at 0.14 $, 0.13 $ and 0.12 $ / 0.125 $.
Stellar Lumens XLM/USD
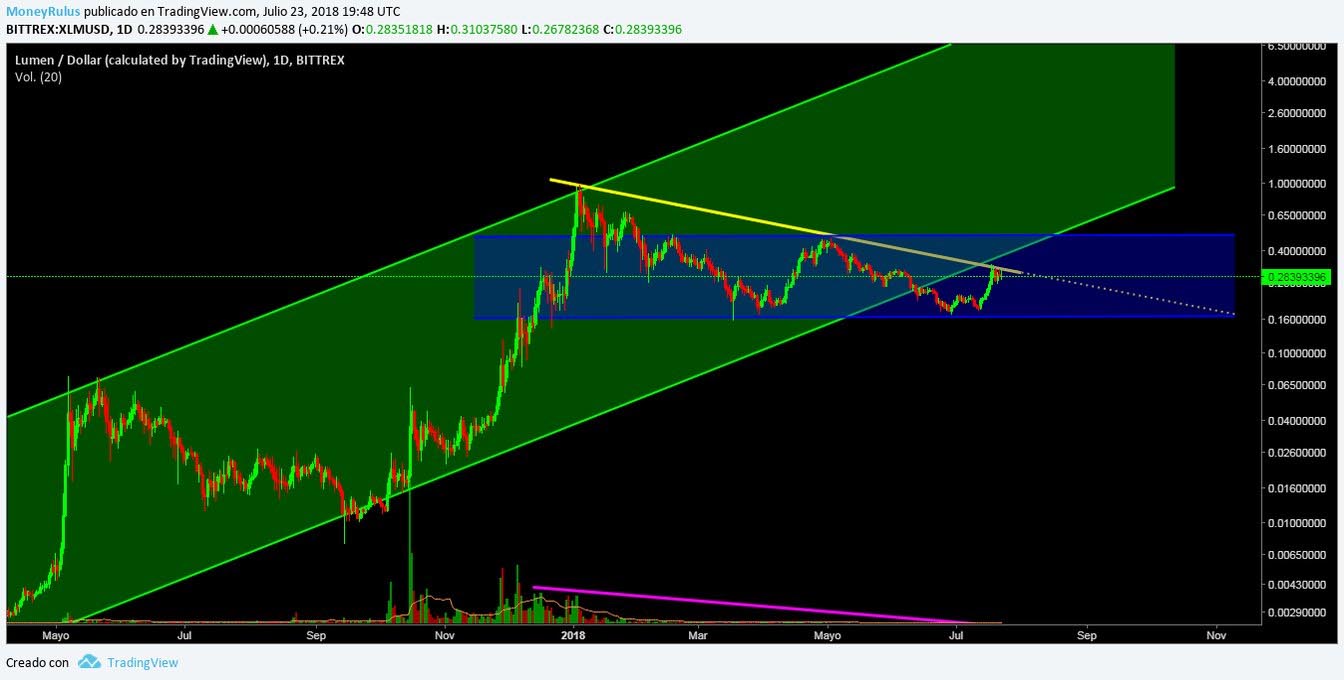
The pair XLM / USD in the Bittrex exchange house shows a clear laterality, the price is within a horizontal channel – blue – medium term, after having bounced in the lower part of the channel, the price seems to be heading to the higher part of it, an area in which clearly the bulls, will have to fight against the sale pressure that the bears will generate, in response to their onslaught.
In addition to that, the price is testing the resistance that is represented by the descending trend line – yellow – medium term, if it manages to break that area, it would change its position and would become an interesting support, although without a doubt it is a potential ceiling area.
In case the price breaks the yellow trend line, it could try to enter again in the long-term upward channel – green –, this channel is an area where historically the price has been for a long time, so it is understandable that it tends to it. In case of achieving it, all the breakage it got out of the price, could have been a trap for bears, of which already we have commented previously.
The volume remains suspiciously low and is practically invisible, so it generates a certain sting when analyzing the currency, this absolute lack of strength only indicates that there is little interest from investors, so we think it would be prudent to act with great caution.
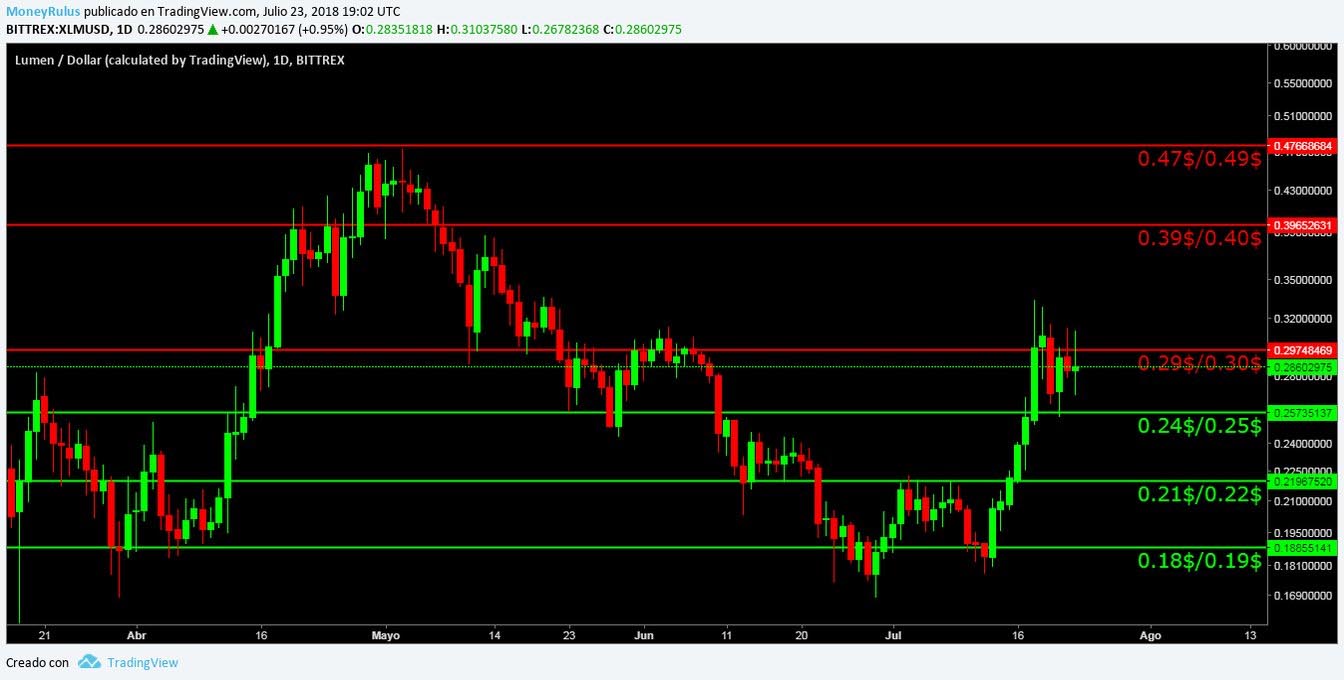
The bears can increase the selling pressure and create resistances in the 0.29 $ / 0.30 $, 0.39 $ / 0.40 $ and 0.47 $ / 0.49 $ zones.
On the other hand, bulls can form interesting supports at 0.24 $ / 0.25 $, 0.21 $ / 0.22 $ and 0.18 $ / 0.19 $.
IOTA IOTA/USD
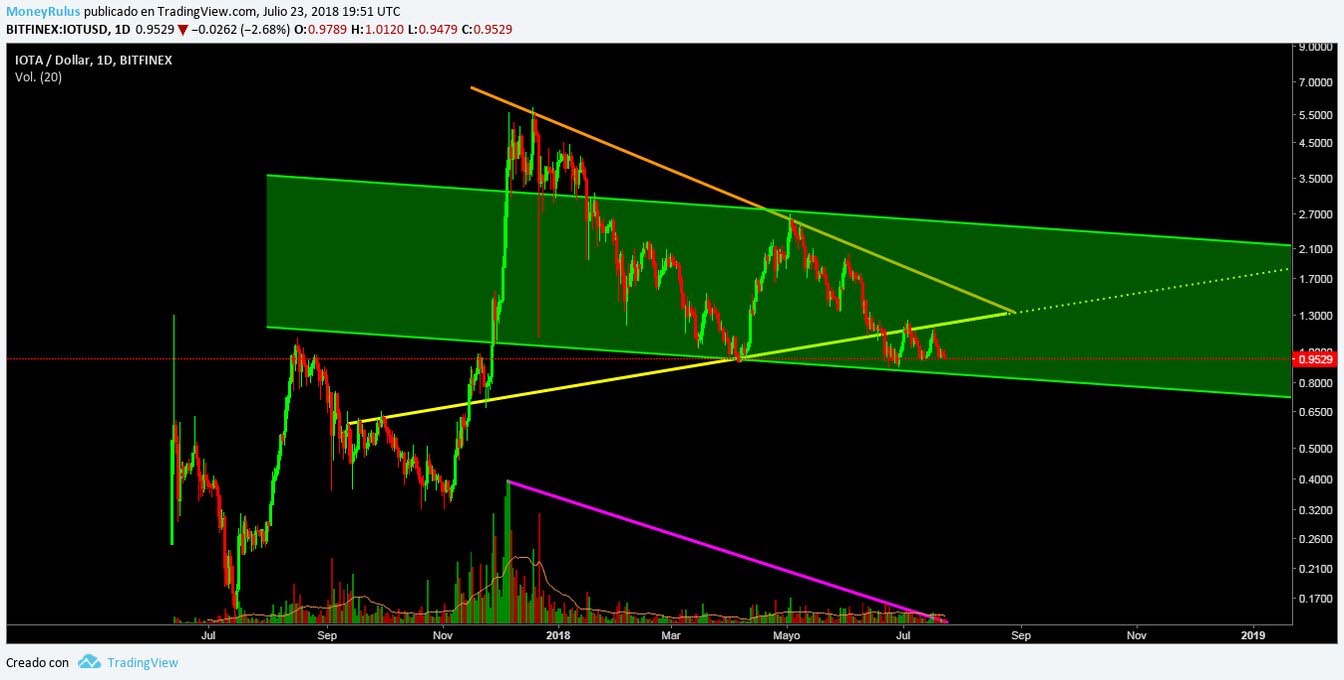
The penultimate pair is IOTA / USD in the BitFinex exchange house, which shows that it is within a medium-term descending – green channel, which has lately supported the price; at this moment it seems that it is heading towards the lower part of the channel, an area where it could later bounce.
In case that this does not happen, the zone would become an important resistance in the currency. During this week the price finished the re-testing towards the long-term upward-yellow trend line, therefore that zone remains as a clear resistance that must be beaten to be able to rise, assuming that at some point the bulls take control in the future.
If the yellow trend line were broken, the next resistance would be the area represented by the descending trend line – orange – medium term, which has not been visited by the price for some time, this however, does not mean that it has no value as a possible ceiling, because the volatility of this market is such that in just one week a currency can advance or retreat by 15%, which is why in such a level of rapid movements, it is always useful to take into account these type of resistances.
In the event that the price bounces in the lower part of the channel and pretends to go to the upper part, first it must beat the resistance formed by the yellow and orange trend lines, which until now, are areas of complete dominance of the bears. The volume during this week, remained similar to that of the previous week, so we noticed that although not much capital comes in, it does not come out, a sign of stability, but not strength.
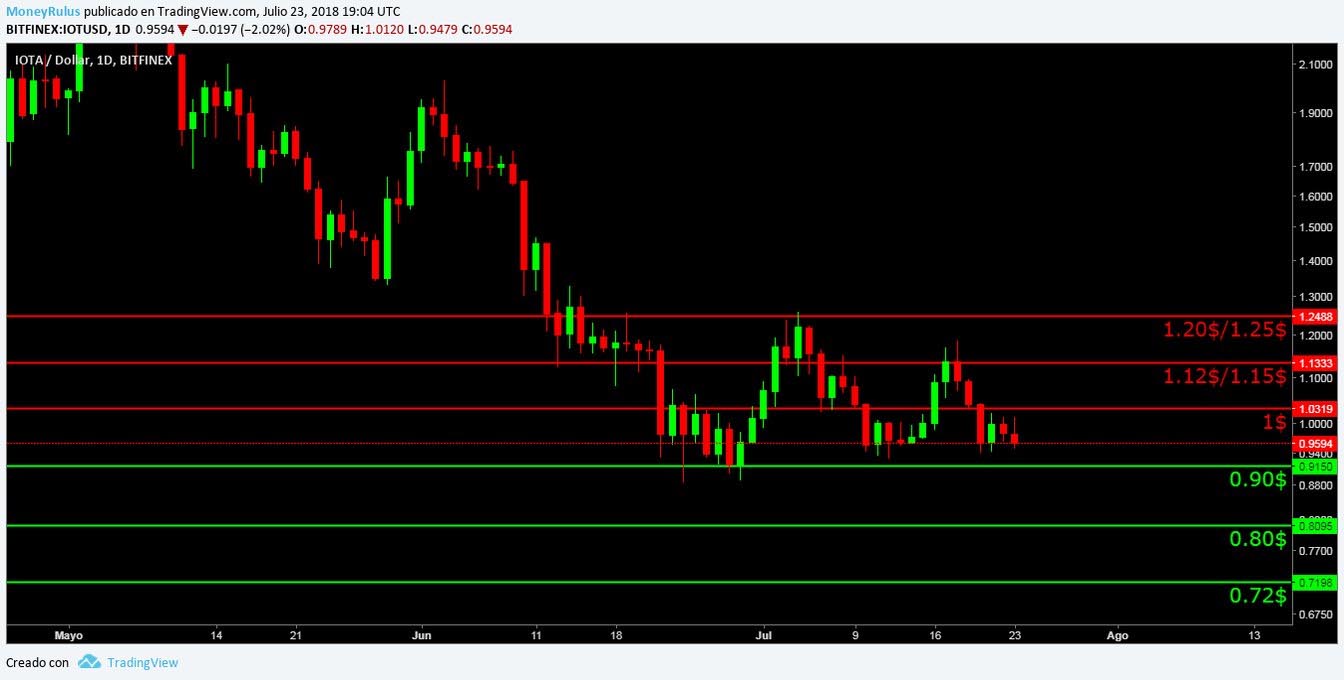
The bears can barricade themselves in the $ 1, $ 1.12 / $ 1.15 and $ 1.20 / $ 1.25 zones to create resistances.
And bulls can respond by creating supports at $ 0.90, $ 0.80 and $ 0.72.
Tron TRX/USD
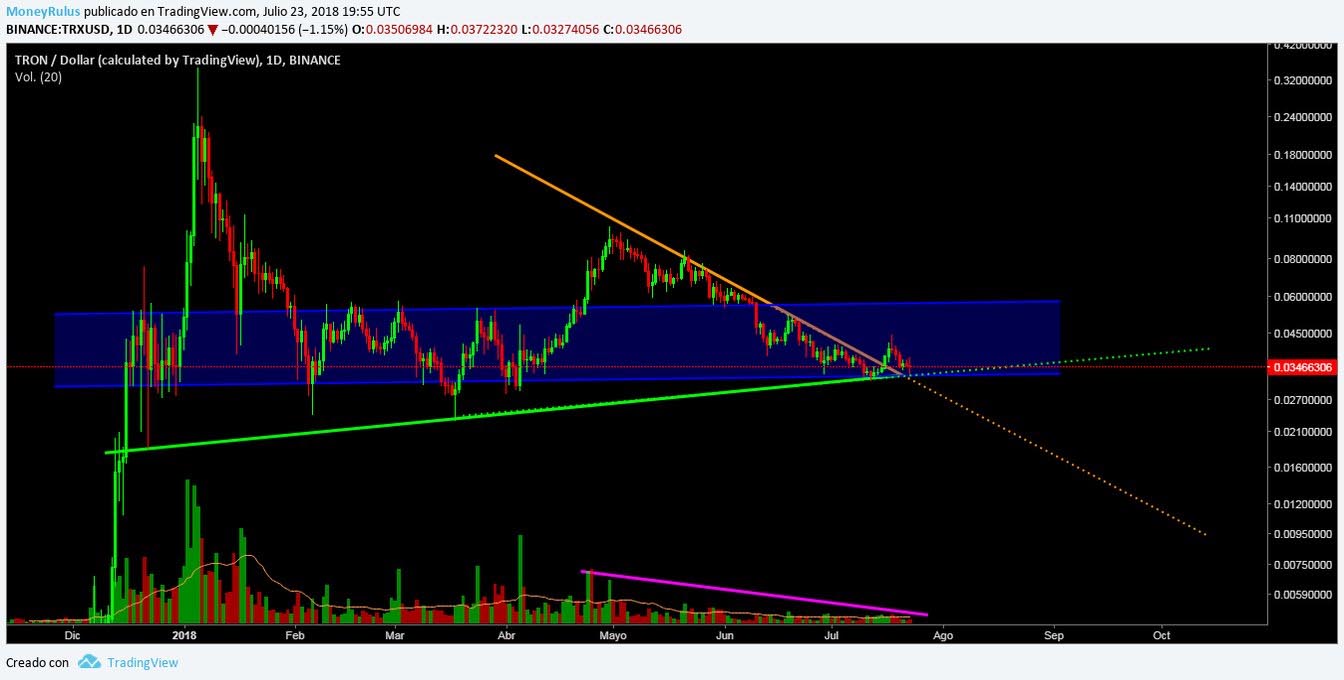
Finally, let’s look at the last TRX / USD pair, which has been maintained since last week in the last position. The graph shows that the price is inside a long-term blue channel, which at this moment seems to be able to support it; If it comes to bounce in the lower part of the channel it is possible that it is directed towards the upper part, so that this area could be a potential resistance in the future.
In addition to that, at this moment the price happens to be using the upward trend line – green – long term, as a support, that trend line has been repeatedly proven as a clear support, so it is not a surprise the fact that it is being a potential ground again.
If the price breaks down the blue channel and the green trend line, both would become prominent resistances, but apart from that, the area of the descending trend line – orange – medium term, would have greater prominence, being able to be a support or a resistance of value.
At this moment the price indicates that the market wants to take a clearly bullish direction, but until having more serious confirmations we do not recommend making decisions. The volume is very similar to that of the past weeks, and even slightly higher, so we can intuit that a bit of capital is entering the currency, while it remains stable, like other currencies, the fact of it being stable does not mean it is strong, so prudence is vital.
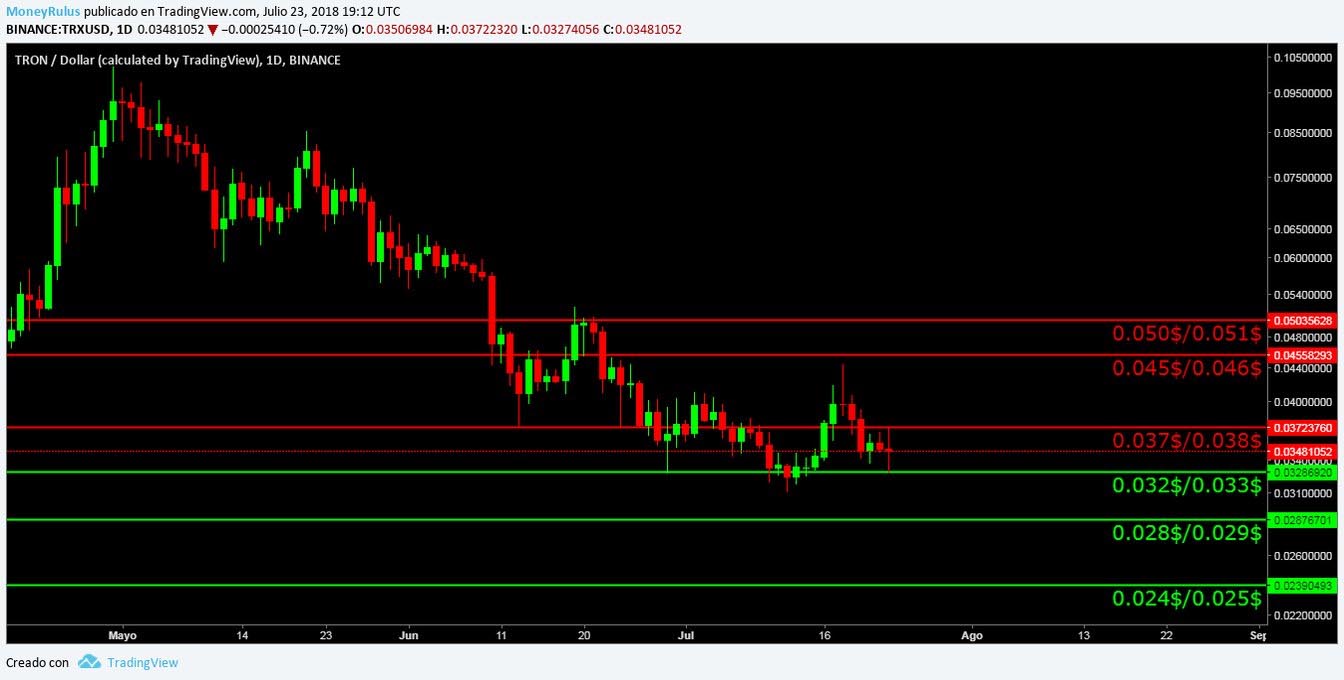
Bears can increase sales pressure and create resistances in the areas of 0.037 $ / 0.038 $, 0.045 $ / 0.046 $ and 0.050 $ / 0.051 $.
Finally, the bulls can do the same and increase the purchase pressure, to create supports in 0.032 $ / 0.033 $, 0.028 $ / 0.029 $ and 0.024 $ / 0.025 $.
“This article has written made by our analyst: José Antonio, Lover of learning and teaching, in love with the trade and enthusiast of the Cryptophere. You can follow him in Steemit or TradingView“