The daily trade of cryptoactives can be extremely profitable, with many full-time traders trading the cryptocurrency markets for a living. Unfortunately, it is not as easy as sitting back, clicking a few buttons and waiting for the money to roll in. The truth is that it takes a lot of hard work to be a successful trader and this involves learning technical analysis of cryptocurrencies.
We will walk through the basics of technical analysis (TA) in this article. But before we jump in…
To Leverage Or Not To Leverage? That Is The Question
Successful traders identify profitable business opportunities using technical analysis (this guide explains the concept in depth). Here they will study and learn to project price movements and wait for the right moment to pounce. Understandably, the patterns of the charts help traders to earn more trades than they lose.
Performing a correct technical analysis will result in a benefit, but successful traders do not stop there. Profitable traders commonly use what is known as leverage to maximize their profits.
Leverage simply means that the gains and losses are magnified by a multiple to the trader’s choice. Five times the leverage means that if a Cryptocurrency increases by one dollar, the leveraged operator will have a benefit of five dollars.
Negotiating leverage is a great way to increase profits, but it can also increase losses. This is the reason why most beginners in trading choose to operate without any type of leverage.
Trading Bankrolls & Managing Them
It is important to understand that even trading wizards are not going to make a profit on every trade. This means it is prudent to not go all-in with your whole bankroll (amount of capital that you are willing to allocate in one operation) in a single trade.
Most operators are only putting at risk 10% of their bankroll in a given operation. Many traders bet even less than that.
The trick with trading is managing your bankroll properly and not exposing yourself to insane risk levels. Otherwise, you are not trading, but gambling.
Bullish Or Bearish Market?
Before logging into an exchange and executing a large number of trades, you must sit down and find out if the market is bullish or bearish. The bull markets are when the market trend is rising and a bearish trend is when market trends tend to fall, this is possible to know thanks to a technical analysis.
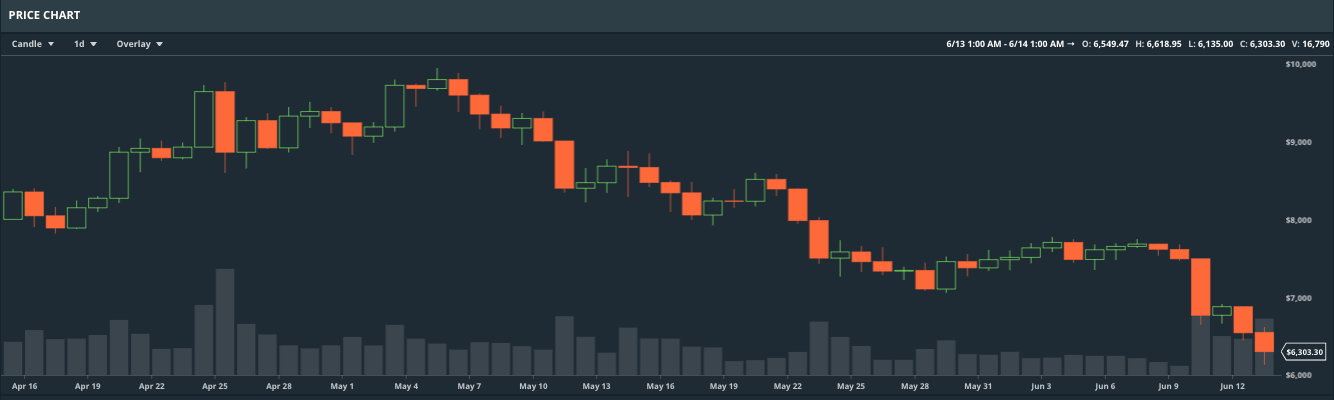
If you have a look at the current Bitcoin chart for May and June, there is no doubt that there is a bearish trend. Most traders study 15-minute or 5-minute candles. Sure, this is a good idea for short-term exchanges, but when determining the overall state of the market it is better to use the one day or even weekly candles.
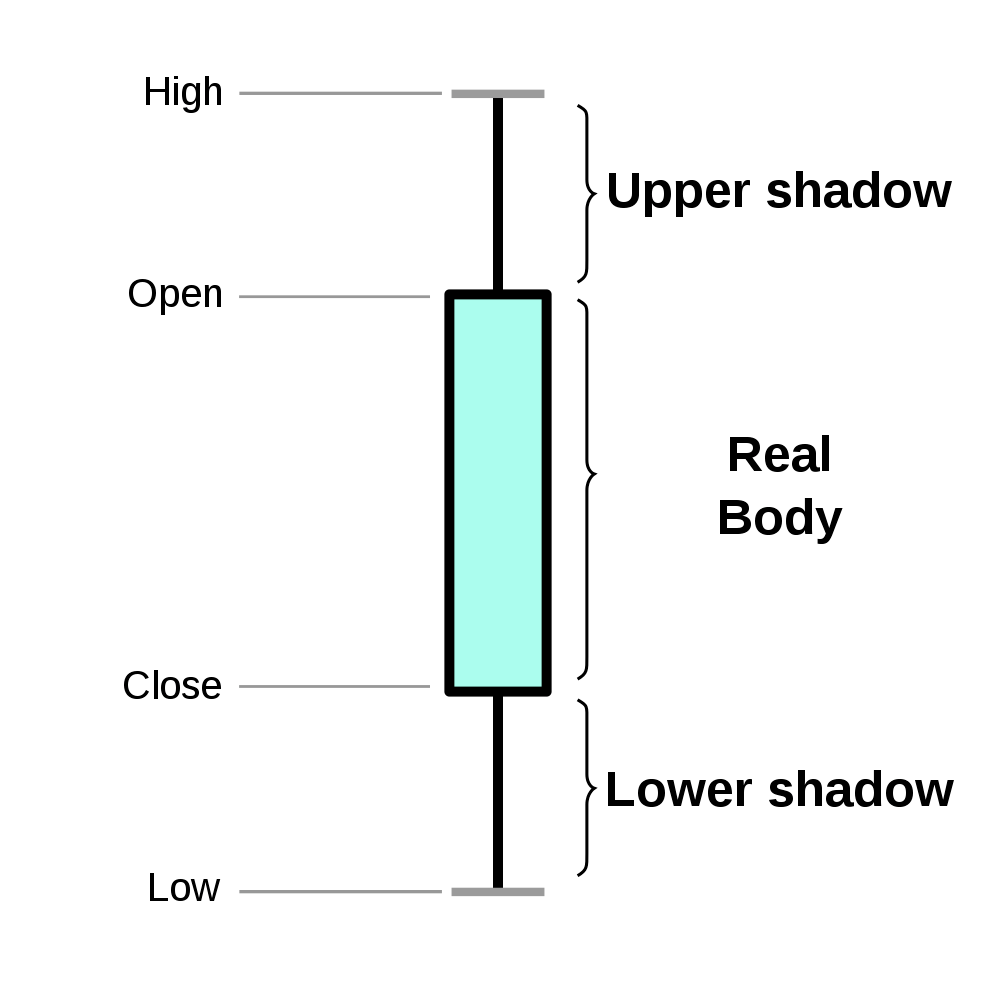
What Is A Candle?
A candle is a type of financial chart that shows the price movements of an asset within a specific time frame. The body of the candle is shown when the price was opened and closed within the given timeframe. You will often see shadows at the top and bottom of the candle, illustrating the minimum and maximum price that the asset was traded at in the given time-frame.
What You Need To Know About Trends
An upper and lower line can be drawn on a graph to show the channel in which a cryptocurrency is being traded. These lines are known as Bollinger bands and are created by using moving averages. When looking for a bullish trend, we typically want to see the lower band remain low and the upper band remaining high. Below is an example of a bullish price channel:
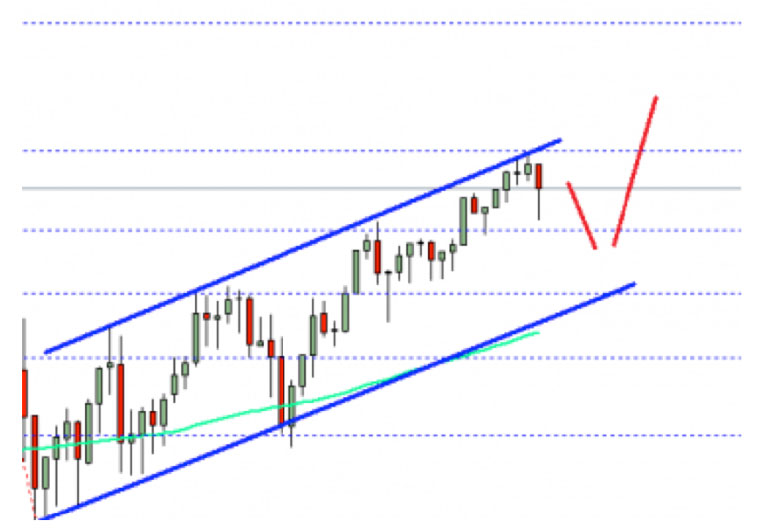
What we can see in this chart is highest highs and highest lows, which is a definite bull trend. The lowest lows and lowest highs are indicative of a bear market.
An intraday trader would try to buy near the last line of support and look to sell when the market reaches its previous high point. If the price rises from the channel and finds support quickly, the trader can decide that his position is long-term.
How To Spot a Bearish Trend with Technical Analysis
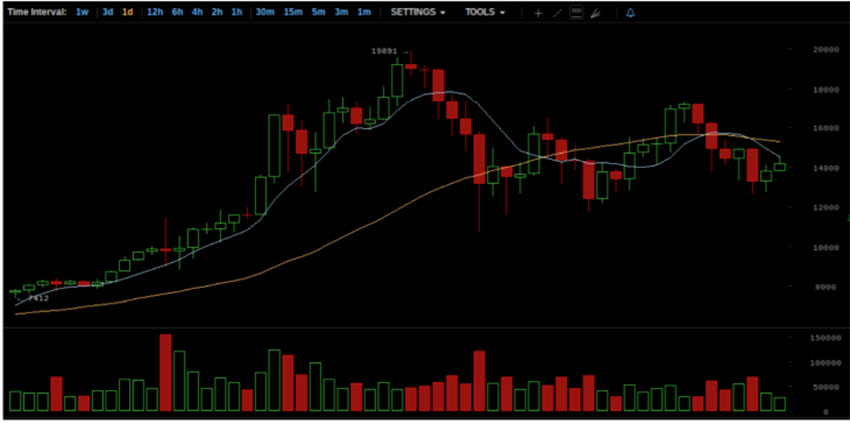
In the above daily chart, we can see that the price of Bitcoin found support in the upper band, since the market reached a record high. Although trade seemed strong on the upward path, the subsequent downward trend was predicted by many technical analysts.
What happened in the chart?
The upper band dipped below the lower one and signaled the target price. This area was priced at 14,500 per Bitcoin. The price then found some support in the lower band for a short period of time. Fundamentally, he could not create adequate support above him.
The bullish race was over and it was just a matter of the market determining how low Bitcoin would go. This price test is known as ‘price discovery’.

The chart above shows the daily chart at the beginning of 2018. You can see that the price action failed to recapture a strong upward trend and this resulted in a wild bearish tren. The Bitcoin price then went into freefall.
Important things to learn from the Chart
- A bullish trend signal was made when the bands crossed backwards and stayed on the first support line.
- When the upper band held support for the first time, this signal indicated that the bulls were back in town.
- The broken support of the upper band resulted in a rapid price drop. This also happened in the previous weekly chart, then the same support lines were broken.
- If the price of Bitcoin suffers the downtrend for a few more days, another cross line will occur and this will signal a even deeper bear market. The $ 6,000 could be touched again.
- A strong resistance of around $ 12,000 was found and this level could not be overcomed when Bitcoin dropped to $ 6,000.
- If the Bitcoin price could have found support at $12k then this would have indicated a bullish confirmation. Unfortunately, it was not like that.
For most traders, a bullish sentiment swept through crypto markets when the price hit $11,000, with many people calling for a $17k Bitcoin again. The truth is they made their call too soon; $12k was the resistance point.
What can you learn from this?
Most traders actually played the Bitcoin market incorrectly in early 2018. The accident happened much later than anyone expected and the graphs looked healthy beforehand. Sometimes the best thing to do is to sit on the sidelines and watch.
When the Bollinger bands rise and fall like waves, it is easy to obtain false signals. Instead, a merchant’s job is to find predictable pricing channels to play with. If you can not find them, why make the bet? The $ 6,000 support was fairly easy to identify and the bullish commercial momentum was a pretty safe bet until the lines crossed.
At this point, Bitcoin has to demonstrate that it will be able to maintain the price momentum before it can establish an upward price channel. If you are a beginner in trading with cryptocurrencies and technical analysis with cryptocurrencies, here is another good article to read in TotalCrypto.
Conclusion
Any trader who knows what they are talking about will tell you that traders cannot sit out of volatile markets. After all, volatility is what generates traders profits. The only way to properly negotiate this price action is by learning how to read candles and how to place Stop-losses.
This is a little more advanced and is certainly worth going into in detail. We will cover this topic and tell you what the most common types of graphic patterns mean in the next part of our of our technical analysis guide. Stay tuned for new updates. For now, we wish the best of luck to all operators that navigate through the cryptocurrency markets.