The market in general, is in a situation of cyclical indecision, the Bulls try to make the price rise to break strong resistance, while the bearish intend to stop them, and make them regress as much as possible. Within this constant battle between both postures, let’s analyze from a technical perspective, what the market indicates about the top 10 of CoinMarketCap.
Bitcoin, BTC / USDT
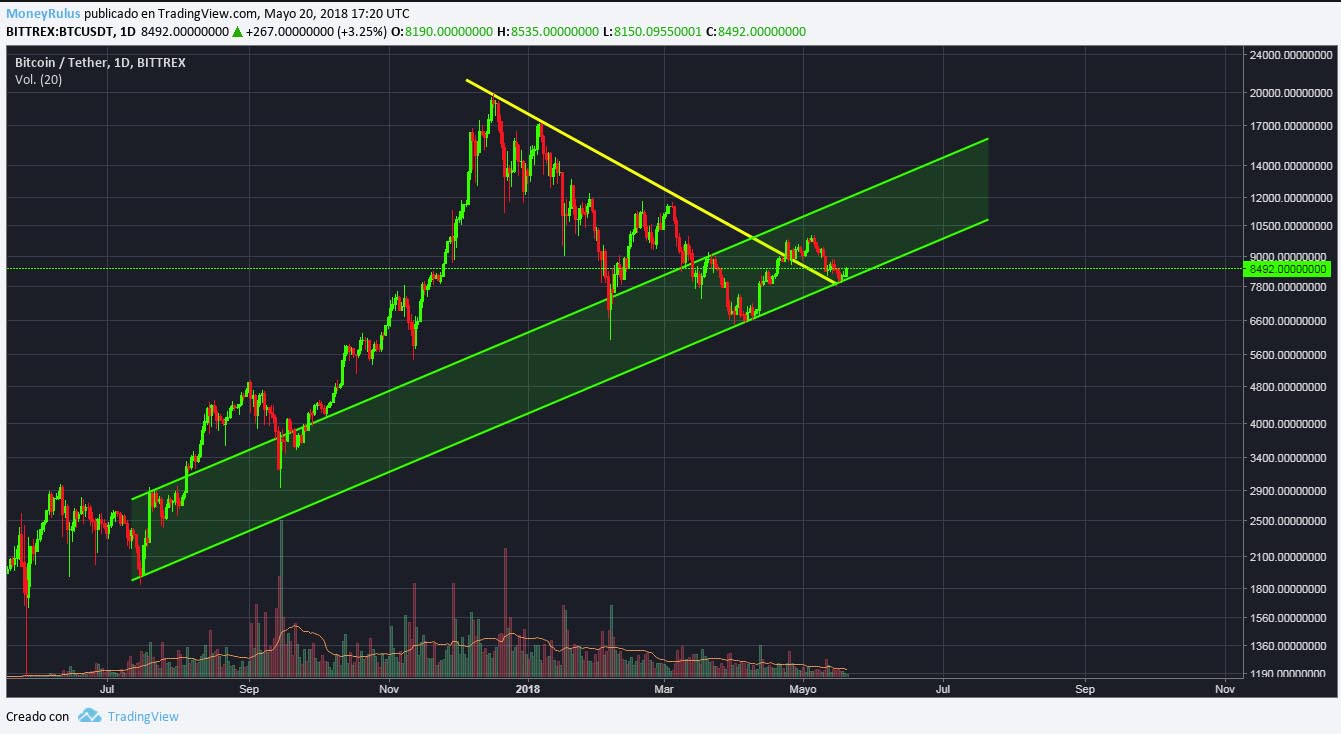
Looking at the BTC / USDT pair at the Bittrex exchange house, we can see that the price quotes show a rising green channel, which has been maintained for some months. At this moment the price is touching the lower part of the channel, so it is possible to make a rebound to go to the top of it. In addition to that, when drawing the trend line (yellow) using the last 3 most important relative maximums, it is visible that the price broke the uptrend line, and now it is making a possible Throw Back. The volume is low, a sign of low strength and indecision.
- If the BTC (Bitcoin) decides to increase its price, resistance can be found in the nearby areas of $8,600 / $8,700, $8,900 / $9,000 (a psychological level) and $9,300 / $9,400.
- If a bearish course is taken place, we can find supports in the areas of $8,000 / $7,900, $7,500 and $7,000, three psychological levels. Knowing this, one should just wait and react as the case may be.
Ethereum, ETH / USD
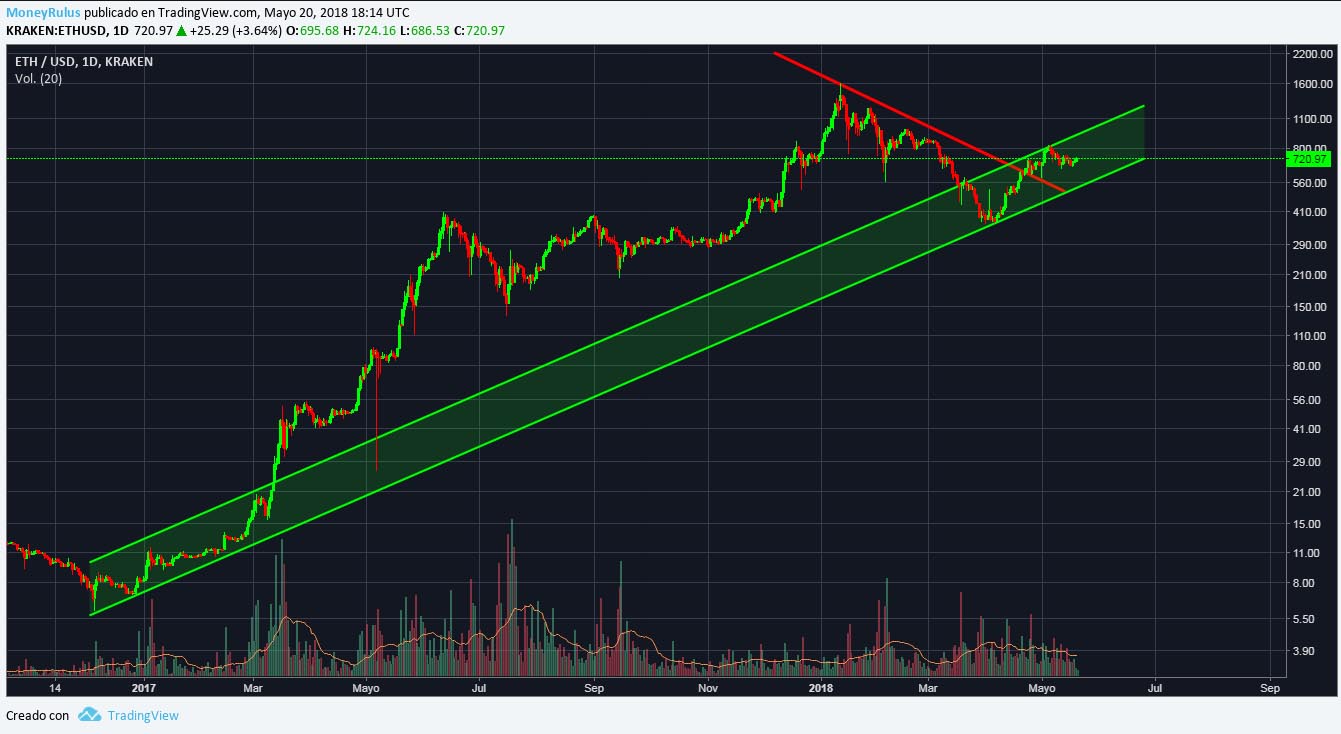
The pair ETH / USD in the exchange Kraken, shows something similar to the ascending channel that we saw in BTC, only that this currency instead of touching the lower part of the channel, finishes touching the superior part, reason why it is possible that it will go towards the bottom. Besides, when drawing the trend line (red) using the last 3 most important relative maximums, it is appreciated that the price broke the uptrend line, and did the Throw Back, unlike BTC. The volume is also low, showing weakness and lack of certainty.
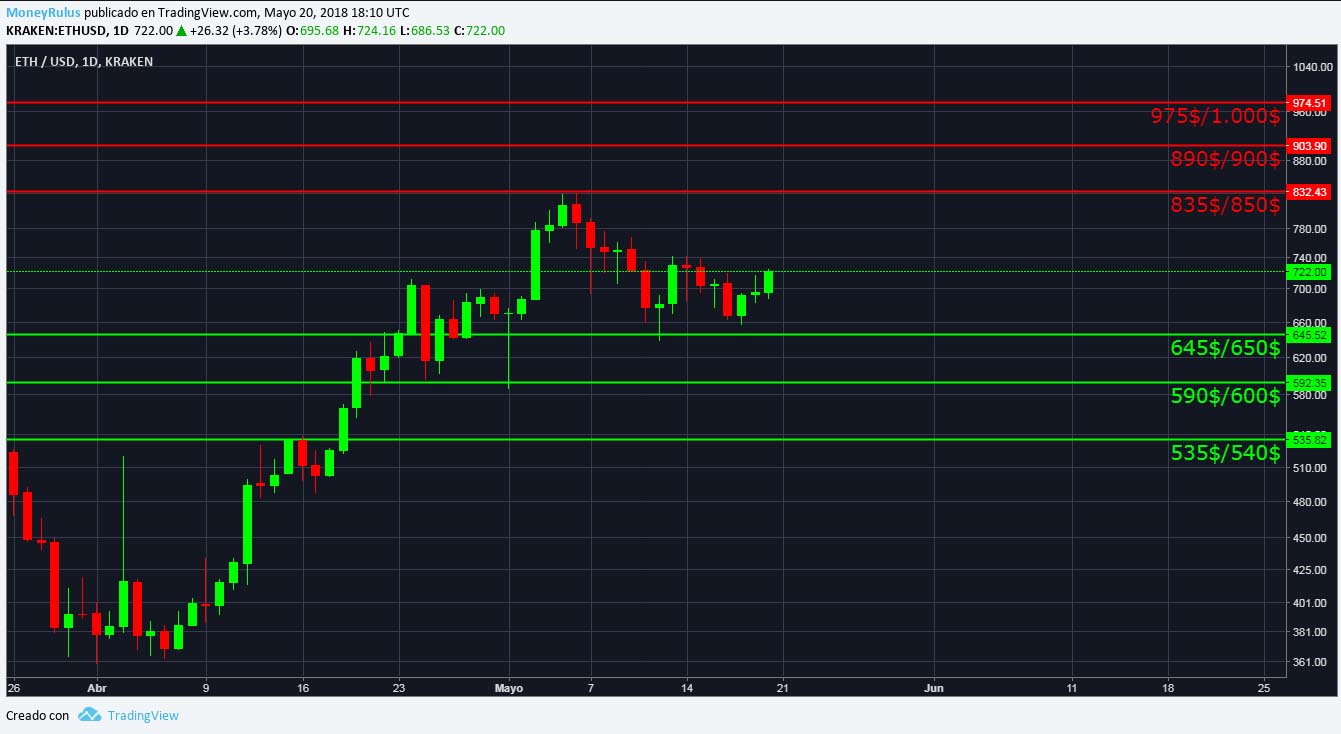
- In case of taking an upward course, you can find resistance at $835 / $850, $890 / $900 and $975 / $1,000, all psychological levels.
- If ETH goes down in price, you can find nearby supports in the areas of $535 / $540, $590 / $600 (a psychological level) and $645 / $650 (psychological level).
Ripple, XRP / USD
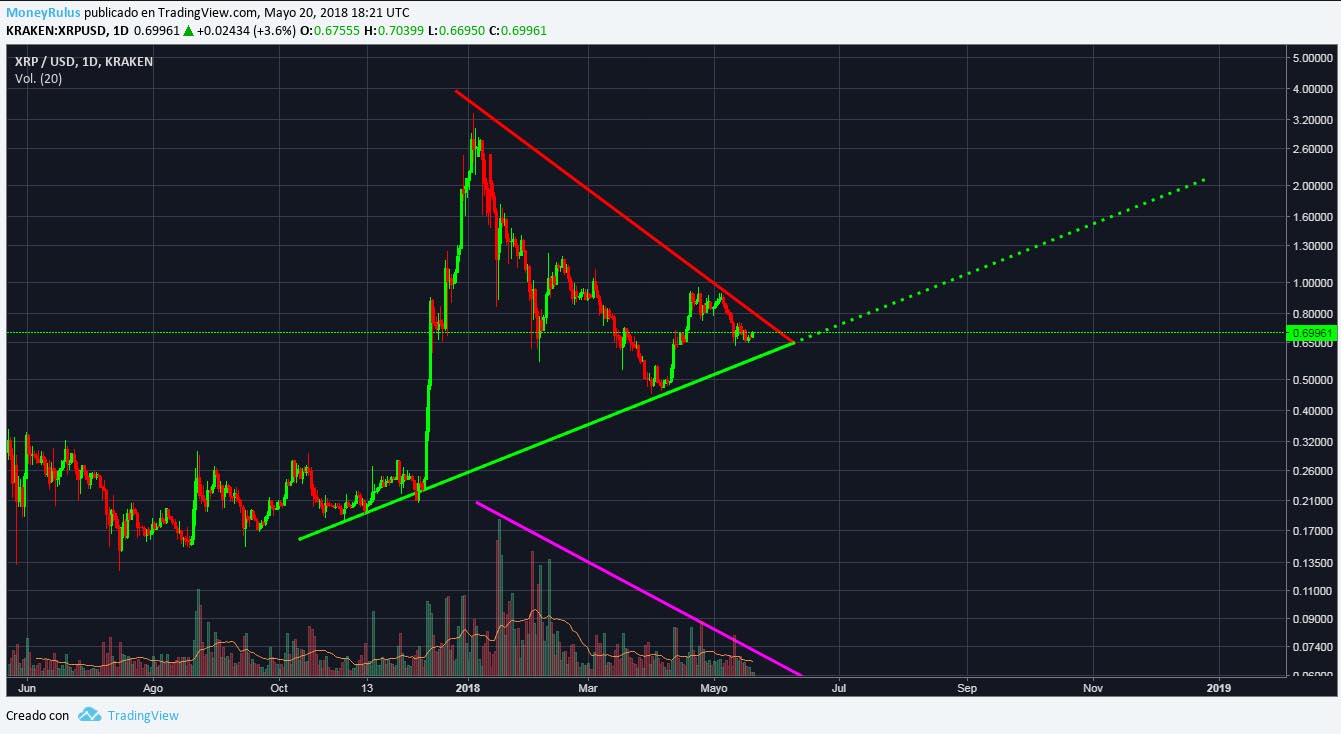
The pair XRP / USD in the Kraken exchange house seems to be forming a symmetrical triangle (pattern of continuation) of great size, the volume has diminished gradually with the advance of the pattern, that is to say it supports (see pink line), this pattern indicates possibility that the upward trend will continue, so if it is broken upwards (with strength), the rising trend line (green line), could serve as support in the future (green dotted line).
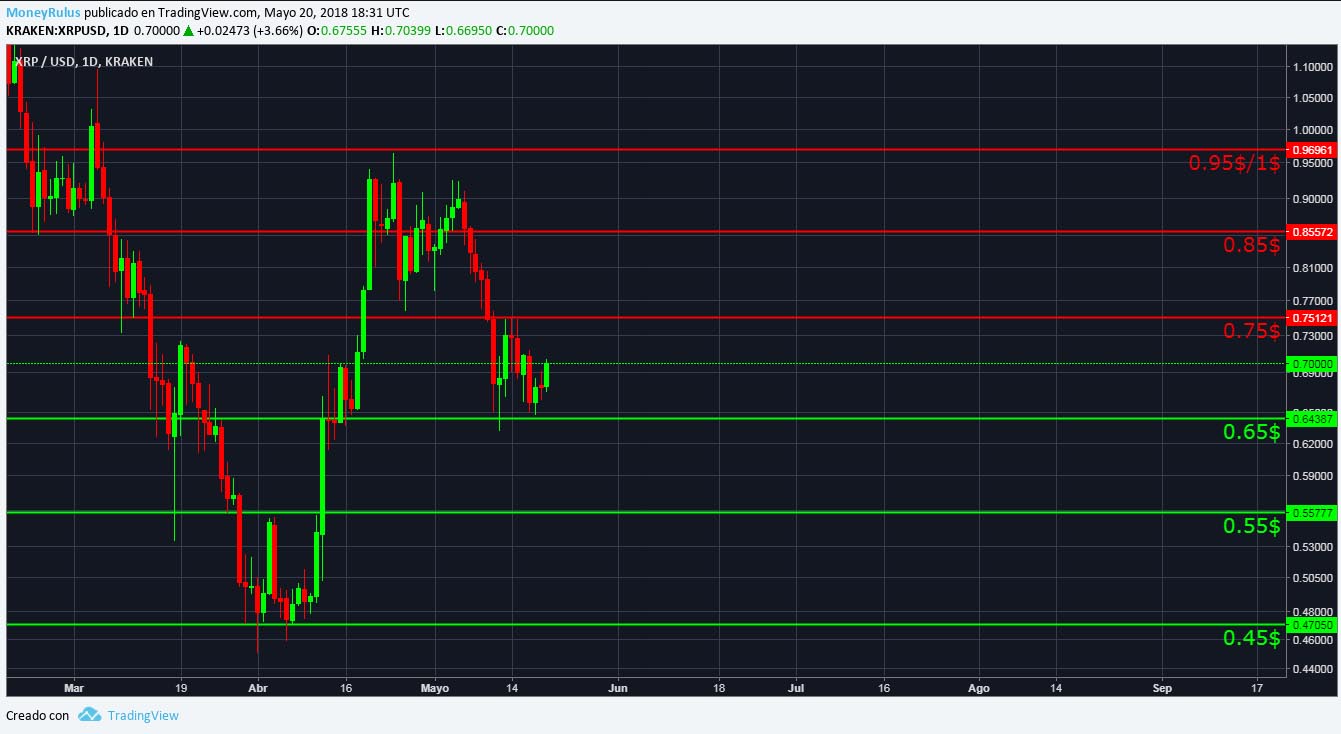
- In case of heading upwards, there may be resistances in the $0.75 , $0.85 and $0.95 / $1 zones.
- Possible supports can be presented in the areas of $0.65, $0.55 and $0.45, both supports and resistances are important psychological levels.
![]() Bitcoin Cash, BCH / USD
Bitcoin Cash, BCH / USD
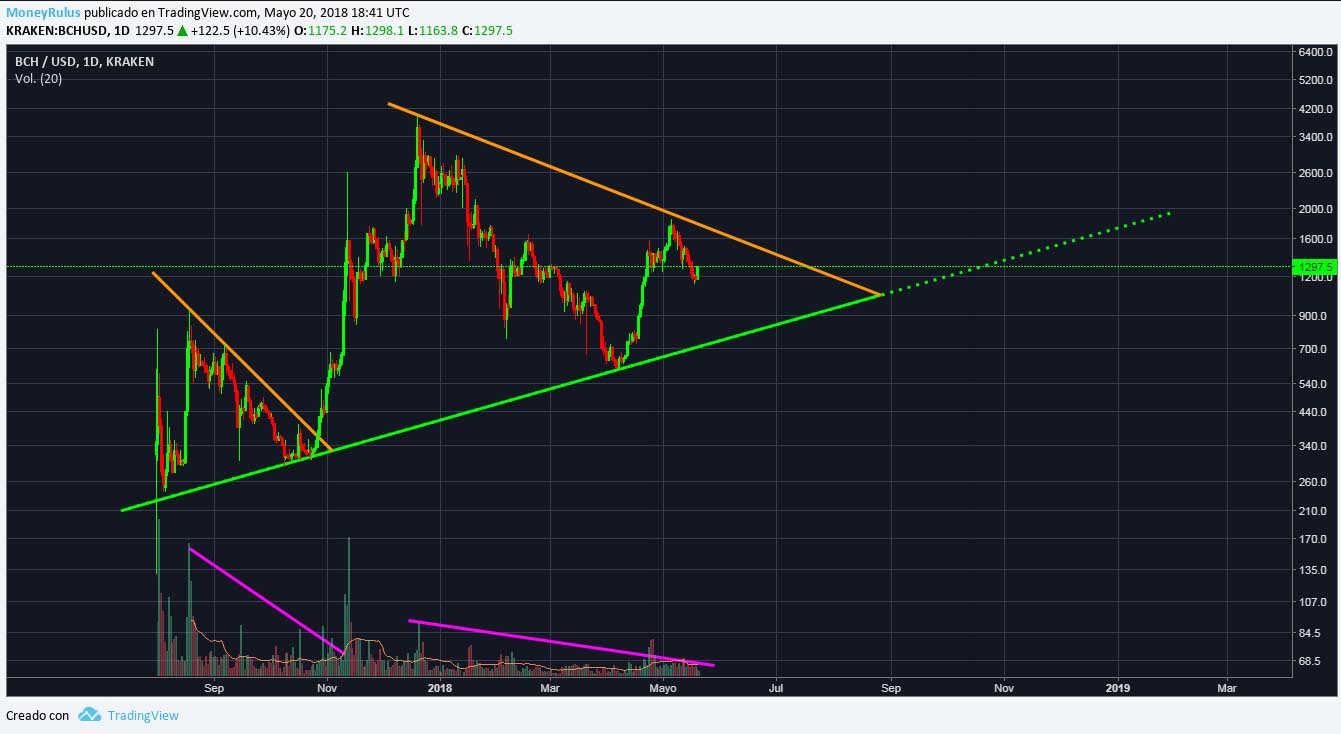
The pair BCH / USD in the Kraken exchange house shows a possible symmetrical triangle similar to the pair XRP / USD, it is a large pattern, the volume has gradually decreased with the advance of it (see second pink line) that is, supports, this pattern, as we can see in the fractal on the left, indicates possible continuation of the uptrend, so if it is broken upwards (with strength), the rising trend line (green line), could serve as a support in the future (dotted green line) as it has in the past, after having broken the symmetric triangle fractal on the left (see the support of the volume, in the first pink line).
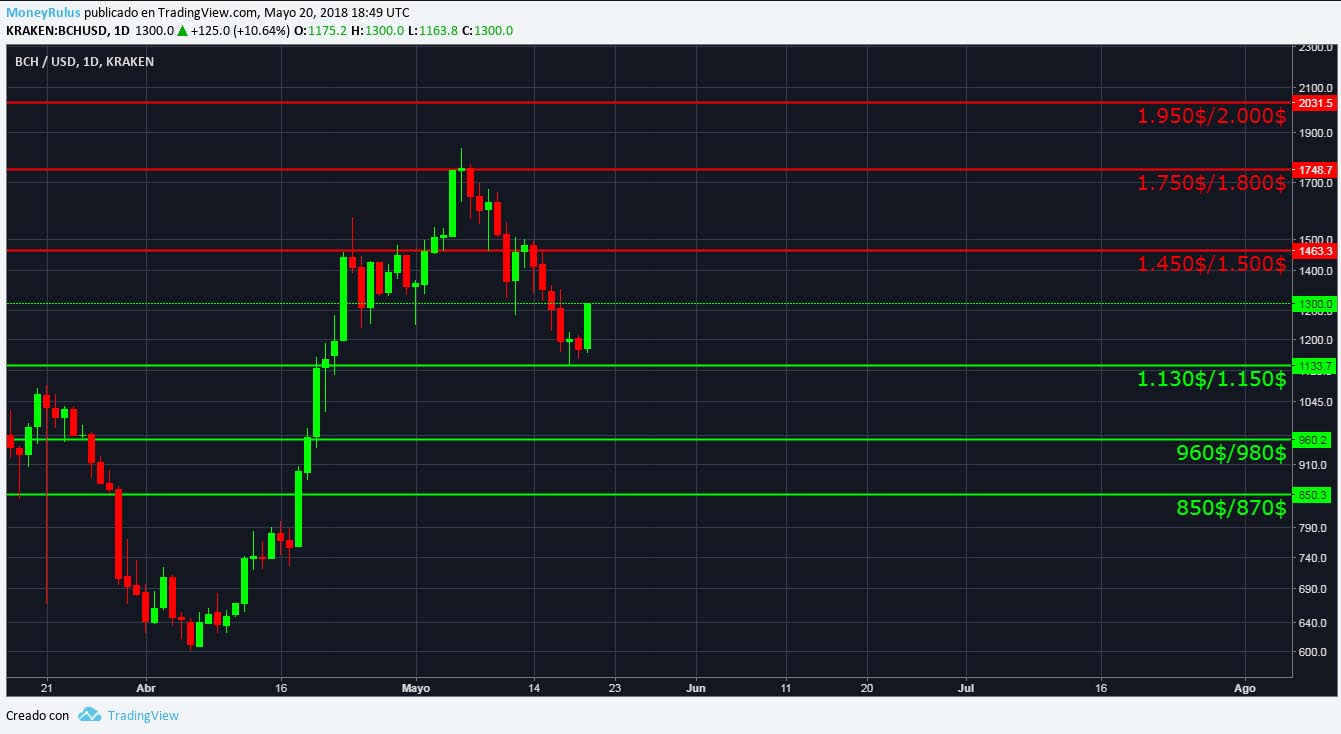
- If it tends to rise, you can find resistances in the areas of $1,450 / $1,500, $1,750 / $1,800 and $1,950 / $2,000 (psychological level).
- If the pair takes a bearish direction, you can find supports in the area of $1,130 / $1,150, $960 / $980 (close to a psychological level) and $850 / $870.
EOS, EOS / USD
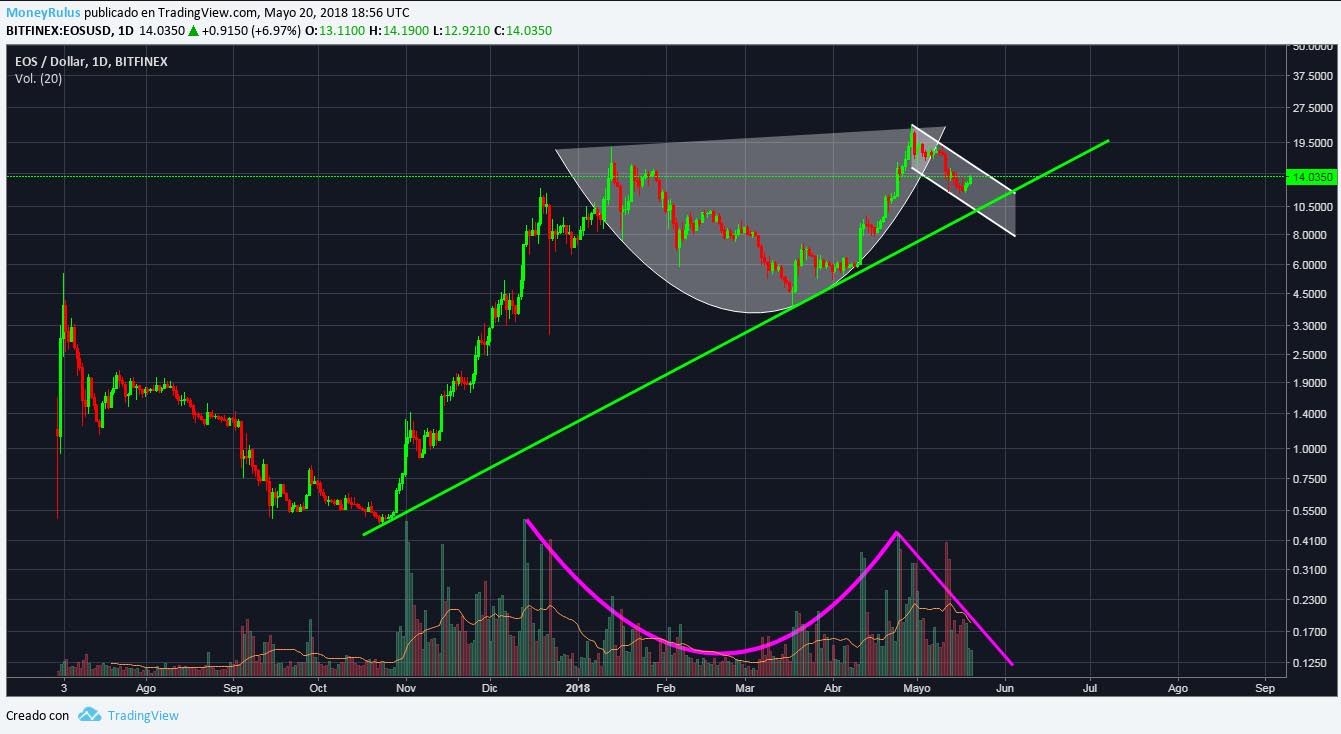
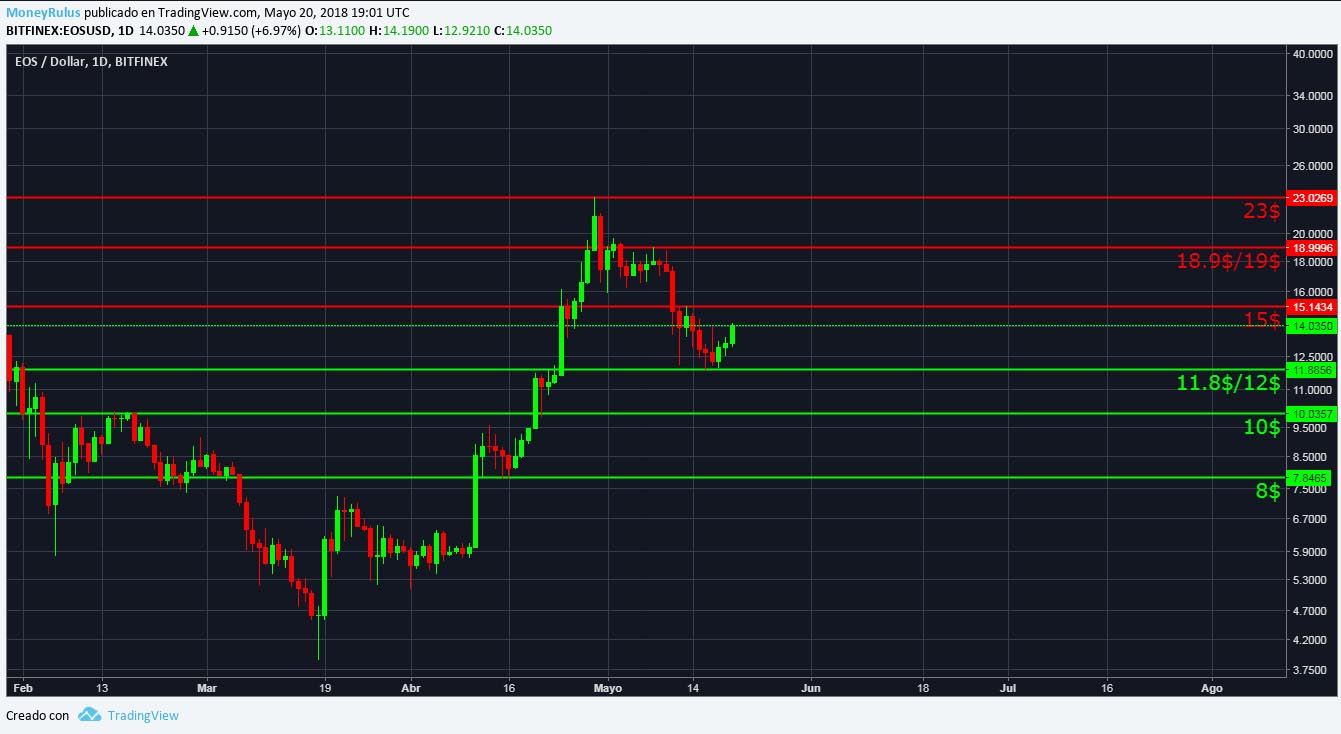
The pair EOS / USD in the BitFinex exchange house stays on the line of upward tendency (green line), and shows a possible Cup & Handle pattern (bullish pattern) that supports this possibility, reason why the tendency still conserves certain force. The volume shows an ideal support (see pink line), practically traced by the theory, which adds a lot of seriousness to the possible bullish pattern.
- If the upward trend continues, the pair may find resistances in the $15, $18.9 / $19 and $23 (the historical maximum) zones.
- In turn, the areas of $11.8 / $12, $10 and $8 can serve as supports, three important psychological levels.
Litecoin, LTC / USD
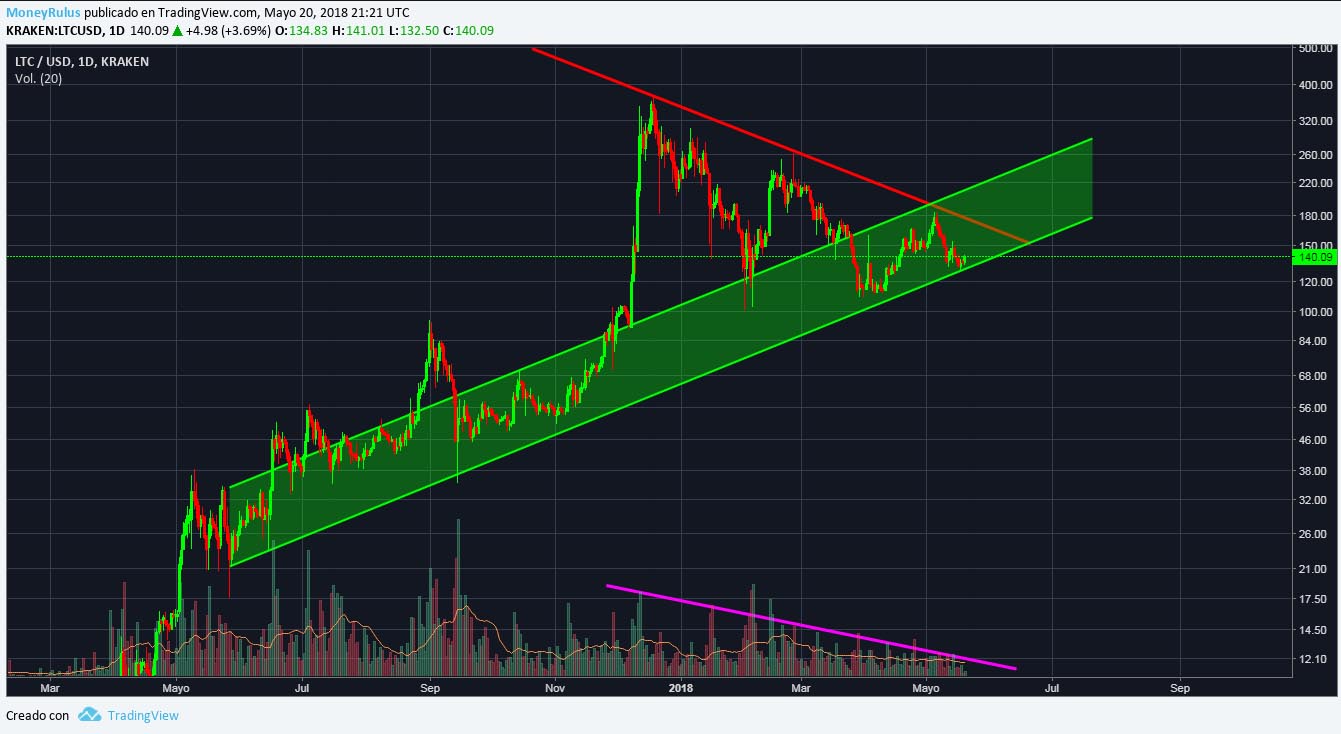
The LTC / USD pair in the Kraken exchange house shows a possible symmetric triangle pattern, supported by volume (see pink line), which adds some reliability to the continuation pattern, that is, to the bullish pattern. In addition to that, the price is currently in an ascending channel, at the moment it is at the bottom of the channel, so it may be directed towards the top.
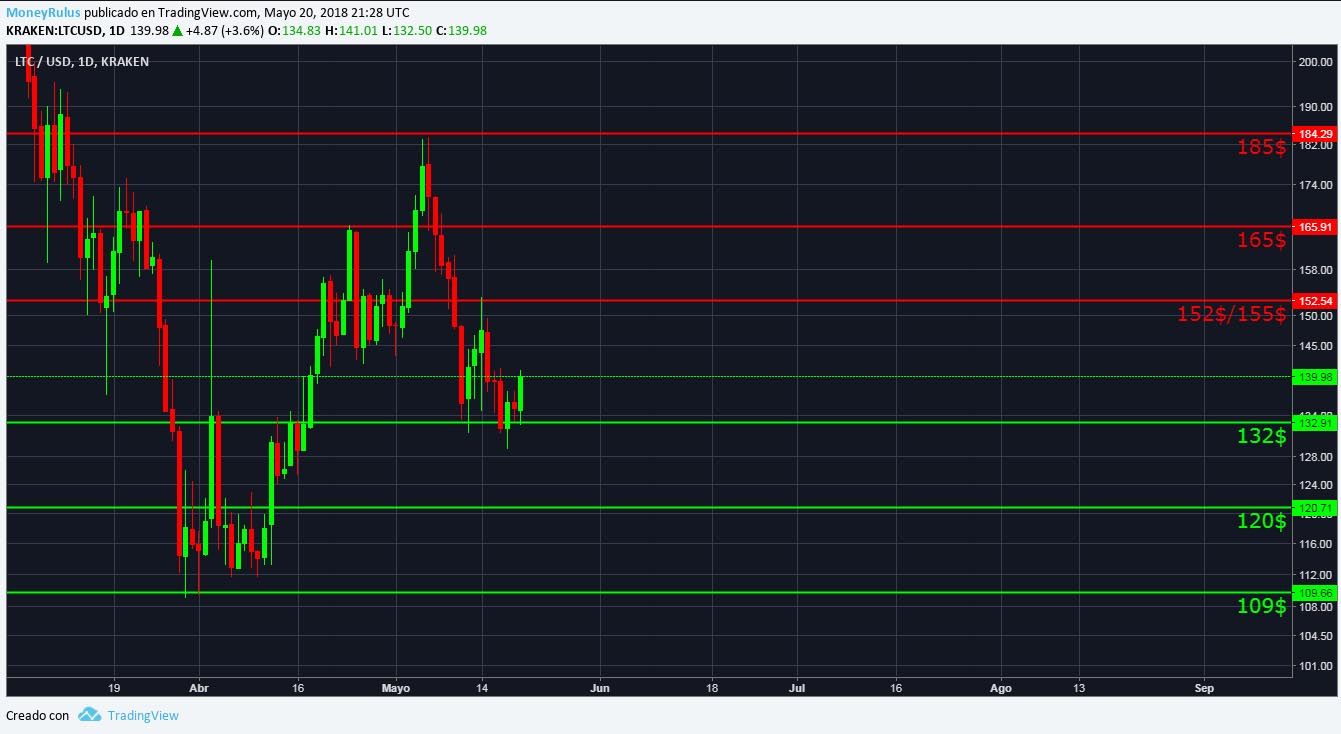
- In case of continuing the advance to the upside, certain zones can be presented as resistances, such as $152 / $155, $165 and $185.
- As supports, the zones will be $132, $120 and $109. Being several supports and resistances, vital areas.
Cardano, ADA / USD
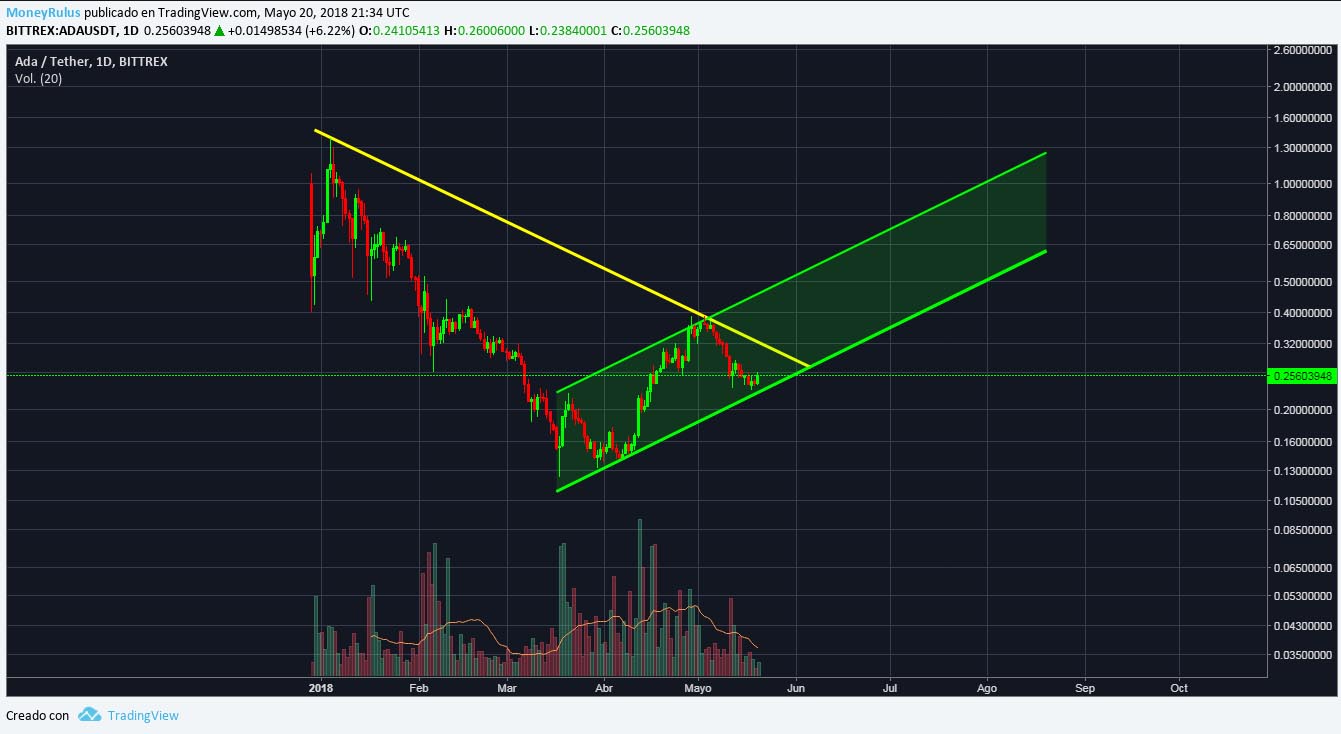
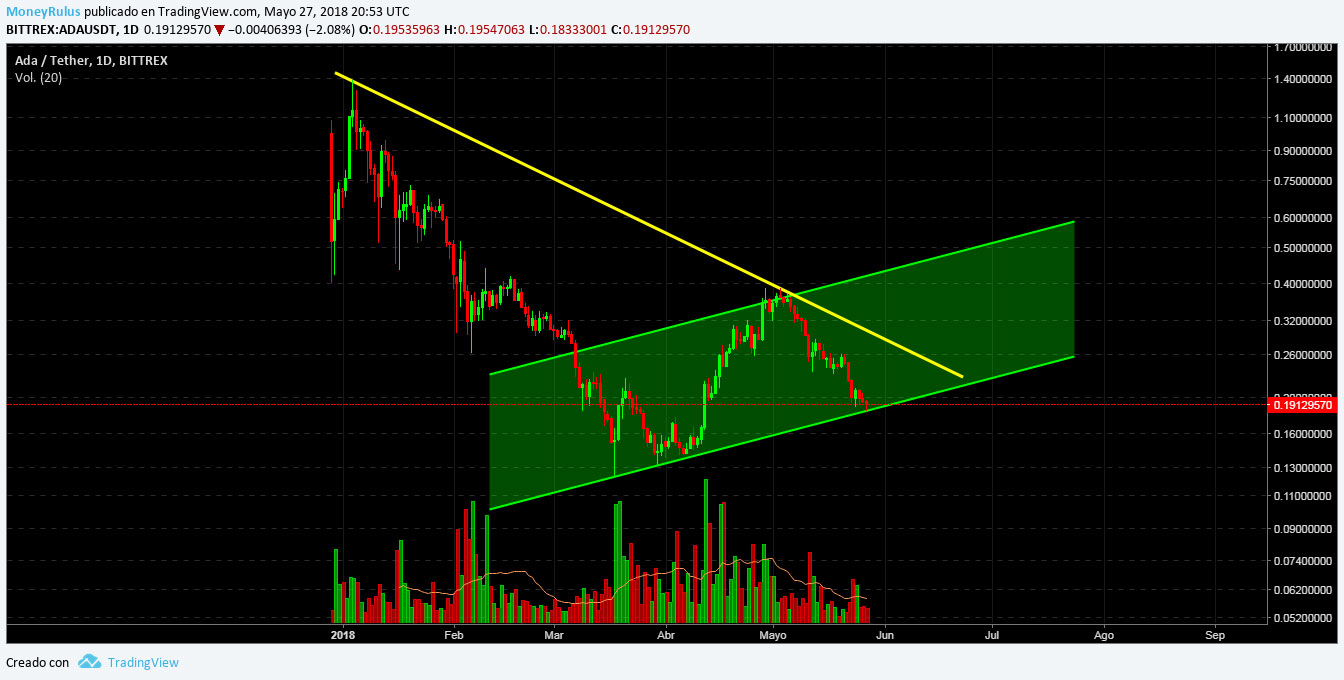
The ADA / USD pair in the Bittrex exchange house, shows that it is in an ascending channel for a couple of months. At the moment it is in the lower part of the channel, so it could bounce and go to the top, it can also be forming a Cup & Handle pattern like the one in EOS. The volume shows weakness, as in other currencies.
- Resistances in the areas of $0.28 / $0.29, $0.32 / $0.33 and $0.39 / $0.40, all resistance levels close to psychological levels.
- There are supports in the areas of $0.22 / $0.23, $0.19 / $0.20 (psychological level) and $0.17.
Stellar Lumens, XLM / USD
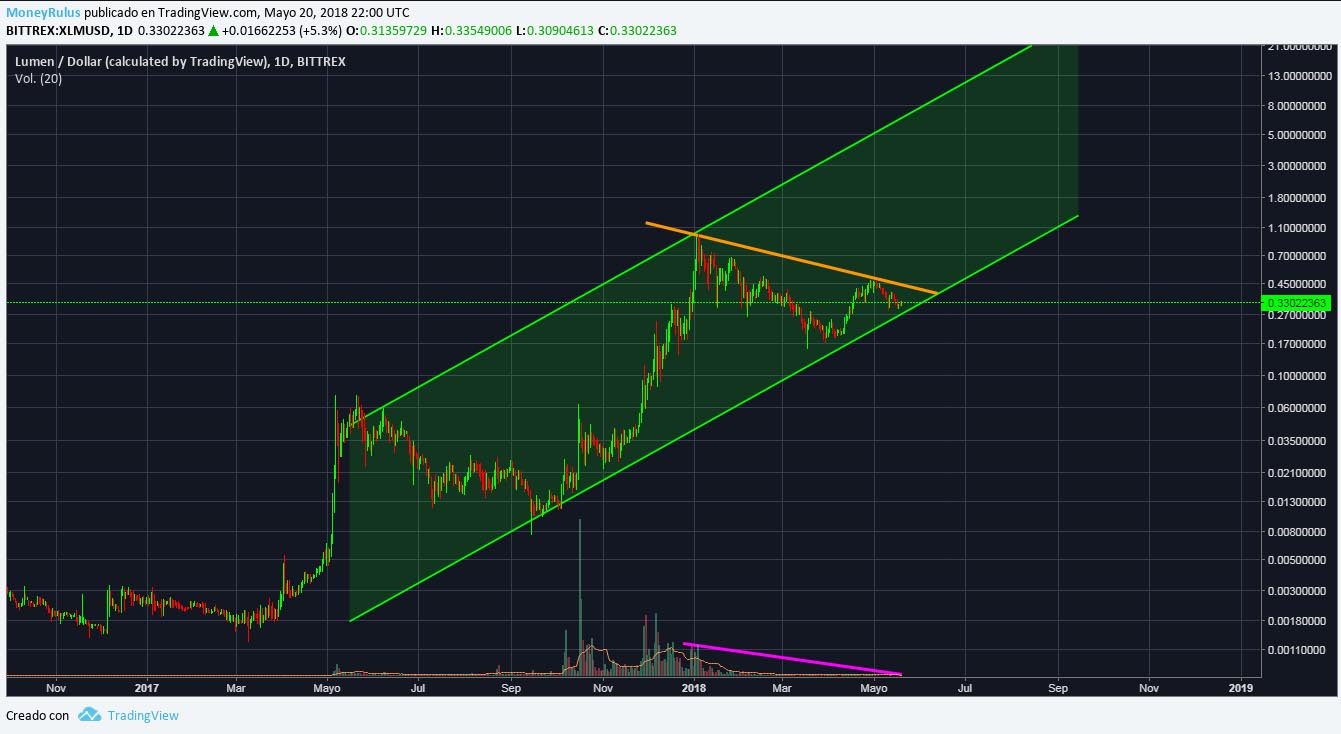
The pair XLM / USD in the Bittrex exchange house shows that one is an ascending channel, touching the lower part of the same, reason why could bounce and go towards the superior part of the channel. In addition to that, there is a possible symmetric triangle pattern, whose upper trend line (orange line) acts as resistance, to reach the top of the channel, the price must break and validate the triangular pattern. The volume supports the aforementioned pattern (pink line), although it should be noted that since the beginning of the year, it is practically imperceptible.
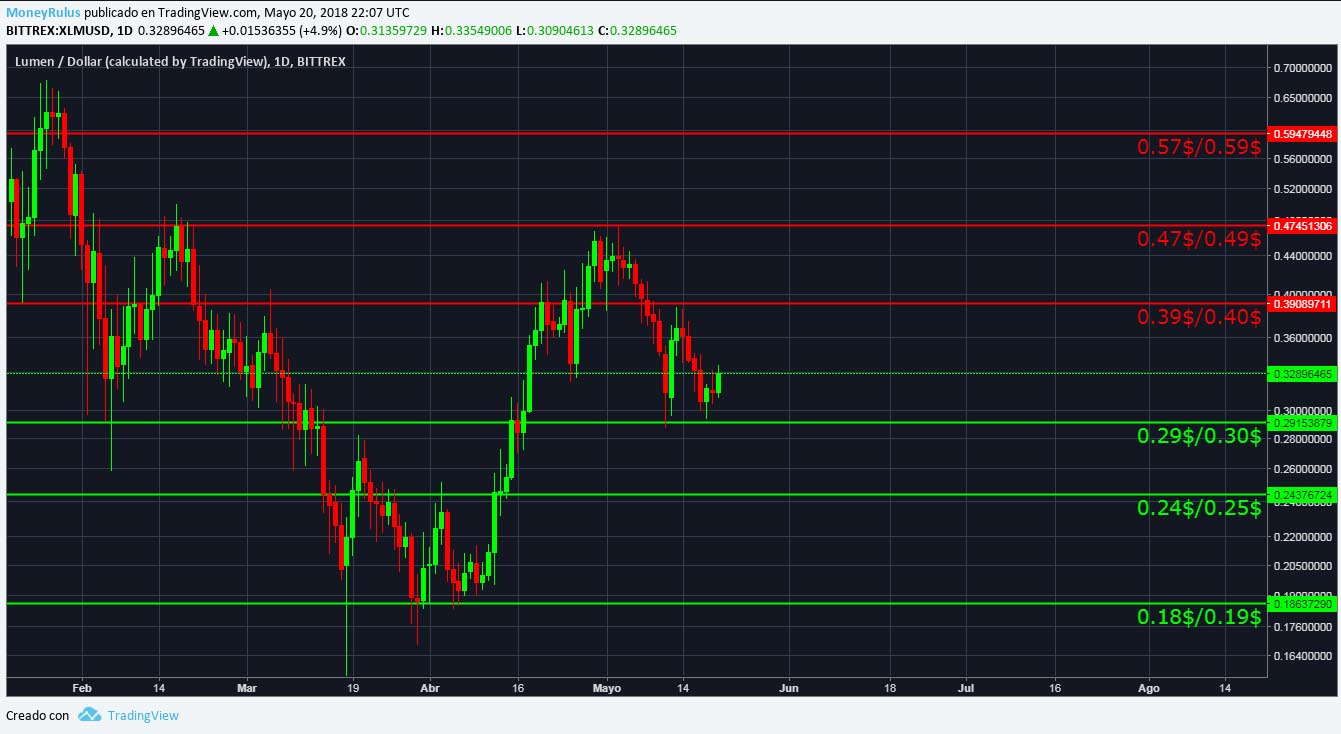
- If the upward trend continues, the price can find resistance in the areas of $0.39 / $0.40, $0.47 / $0.49 and $0.57 / $0.59 (very close to psychological levels).
- Supports in the areas of $0.29 / $0.30 (psychological level), $0.24 / $0.25 and $0.18 / $0.19.
IOTA, IOTA / USD
The pair IOTA / USD in the BitFinex exchange house shows that the price is within an ascending channel, after having touched the top of it, so it is possible that it is directed towards the bottom. Besides that, it shows a possible symmetric triangle pattern like other coins, this pattern is supported by the volume (pink line), so it has some reliability, in addition to showing a possible upward path in the future, continuing with the current trend.

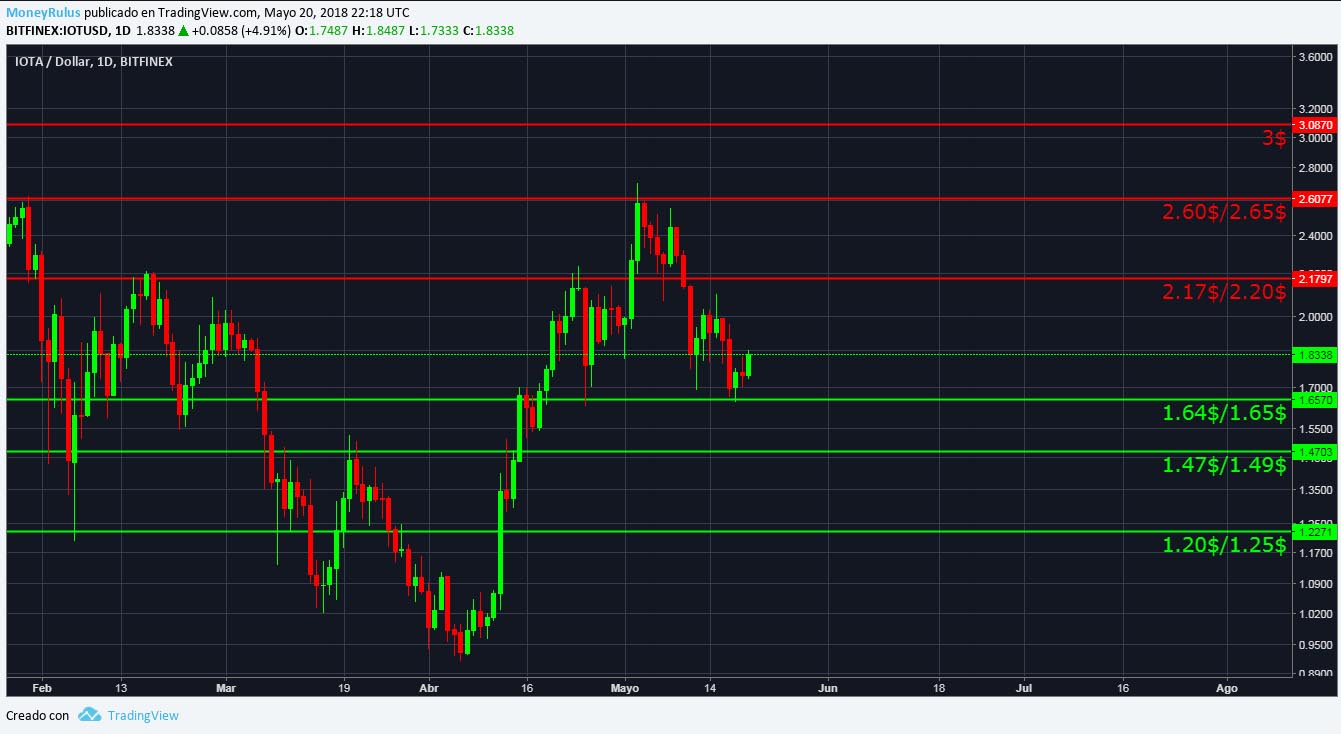
- If the market decides to go up, the price can find resistance in the area of $2.17 / $2.20, $2.60 / $2.65 and $3 (a great psychological level).
- It also present supports in the areas of $1.64 / $1.65 , $1.47 / $1.49 (close to a psychological level) and $1.20 / $1.25. Vital areas, for the future of this currency.
Tron, TRX / USD
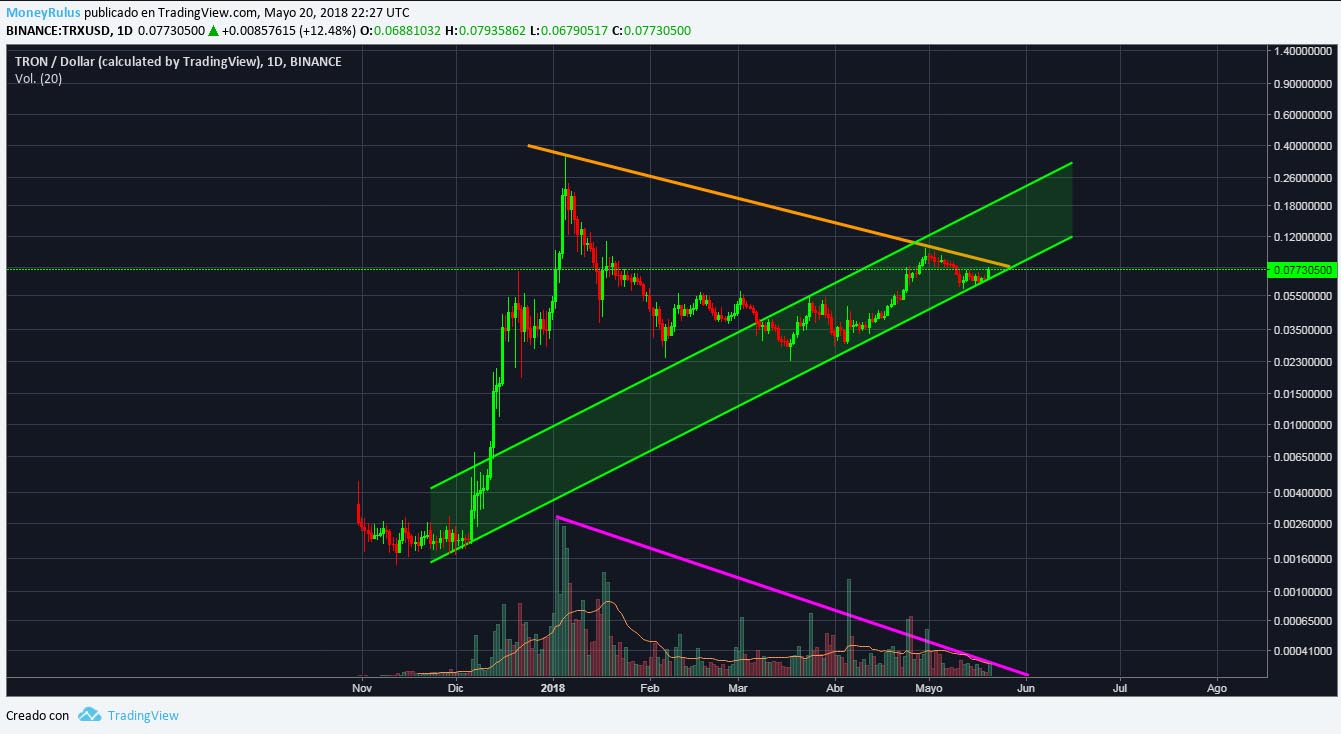
Finally, let’s talk about the pair that displaced NEO from the last position of the ranking, TRX / USD in the Binance exchange house, at this moment it shows a great symmetrical triangle pattern, similar to the one present in BCH, it is of great importance and is supported by the volume (pink line), which adds seriousness to the triangle. This type of patterns is a continuation, so in this case, it is a purely bullish possibility, since it would continue with the current trend. In addition to that, the price is within an ascending channel, just touching the bottom of it, so it is possible to go to the opposite side of the channel.
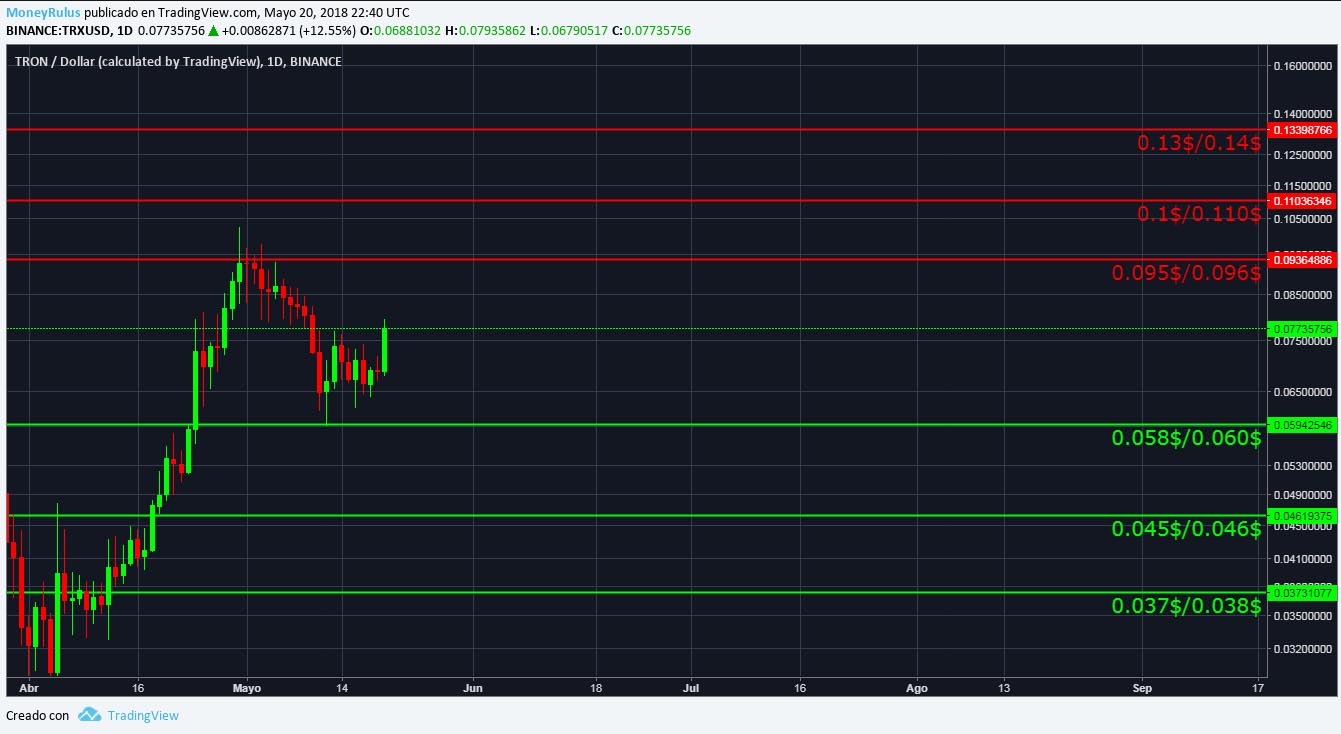
- To conclude, if TRX decides to go up, it can find resistances in the areas of $0.095 / $0.096, $0.1 / $0.110 and $0.13 / $0.14, areas close to psychological levels.
- In case of a falling trend, the price can find supports in the areas of $0.058 / $0.060, $0.045 / $0.046 and $0.037 / $0.038, supports also close to vital figures, something understandable in the current situation.


