The general market of the cryptocurrencies has had a rebound from last week until the present moment, the general capitalization of the market was close to $ 310,773,000,000, and then made a rebound to the figures that are present now, close to $ 350,225,000,000, a significant difference of more than $ 39,000,000,000 that has increased in the last 7 days. All this increase, has given a small reprieve to the market, thus, let’s see what happened with the top 10 coins with the highest capitalization according to Coin Market Cap, during the last 7 days.
Bitcoin, BTC / USD
Observing the BTC / USD pair in the BitFinex exchange house, it is appreciated that the price quotes show the same ascending green channel. At this moment the price seems to have rebounded in the lower part of the channel, so it is possible that it is going to the top of it. Besides, when drawing the trend line (yellow) using the 3 most important highs of this year, it is visible that the price continues to respect the resistance that this line represents. And when doing the same with the 3 most important minimums of this year, the support that the same line constitutes (orange) is still respected. The volume remains low, signal of little force in the market, although the rebound of the price has been remarkable.
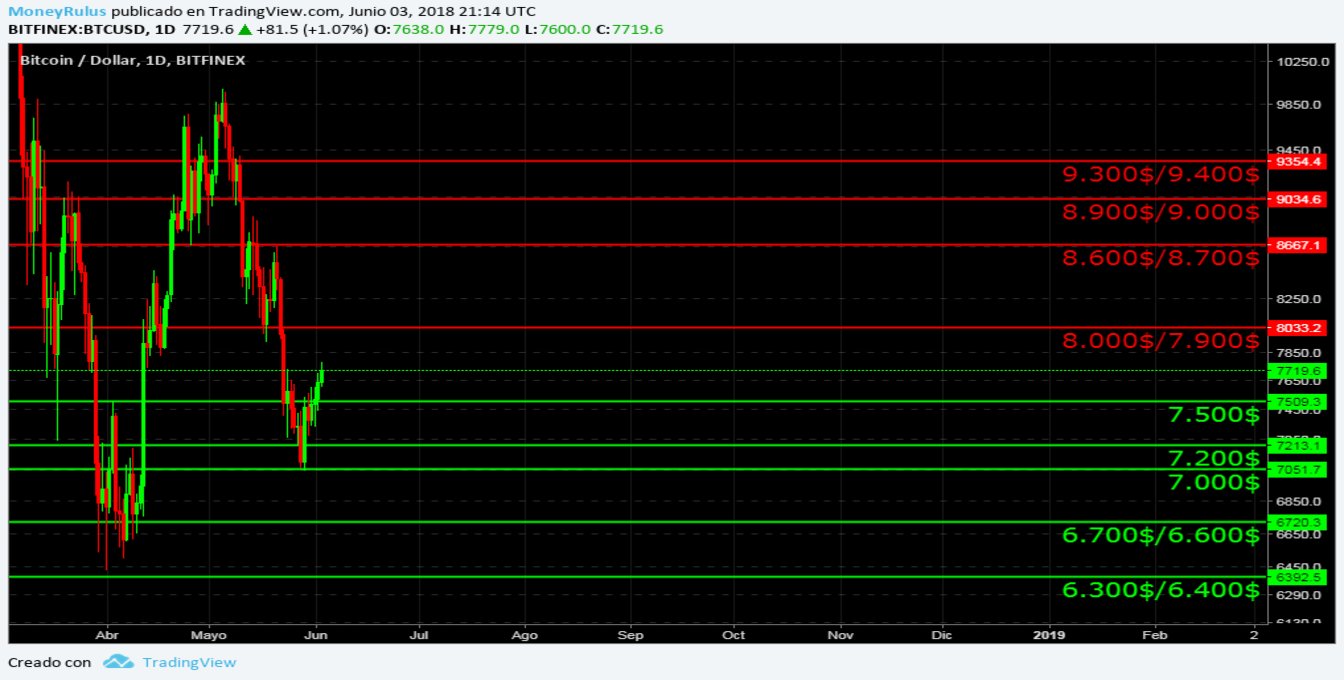
- The supports and resistance discussed in the last analysis remain in force, after the resistance of the $ 7,500 area has been broken and converted into a support. If BTC decides to go further, it can find resistances in the areas of $ 8,000 / $ 7,900 (a psychological level), $ 8,600 / $ 8,700, $ 8,900 / $ 9,000 (another psychological level) and $ 9,300 / $ 9,400.
- If BTC continues the bearish mid-term course, it can find supports in the areas of $ 7,500, $ 7,200, $ 7,000 (in this area you found significant support so far), $ 6,700 / $ 6,600 and $ 6,300 / 6,400. $, all psychological levels.
Ethereum, ETH / USD
The pair ETH / USD in the Kraken exchange house, shows something analogous to the ascending channel seen in BTC, it seems to have bounced in the lower part of the channel, reason why it can go to the higher part. Separately, when drawing the trend line (yellow) using the last 2 highs of greater importance so far this year, it is seen that the line remains as a current resistance. The volume continues to decrease, showing impotence, although the rebound is easily appreciated.
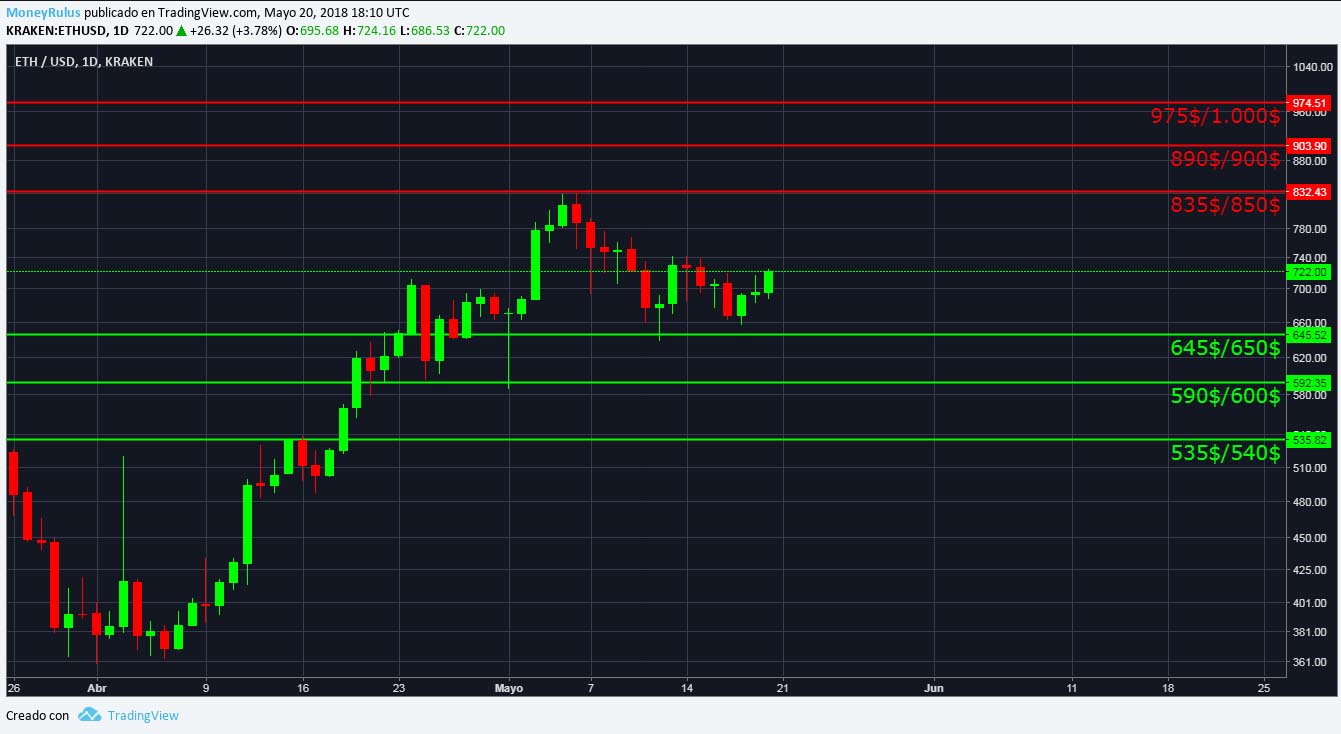
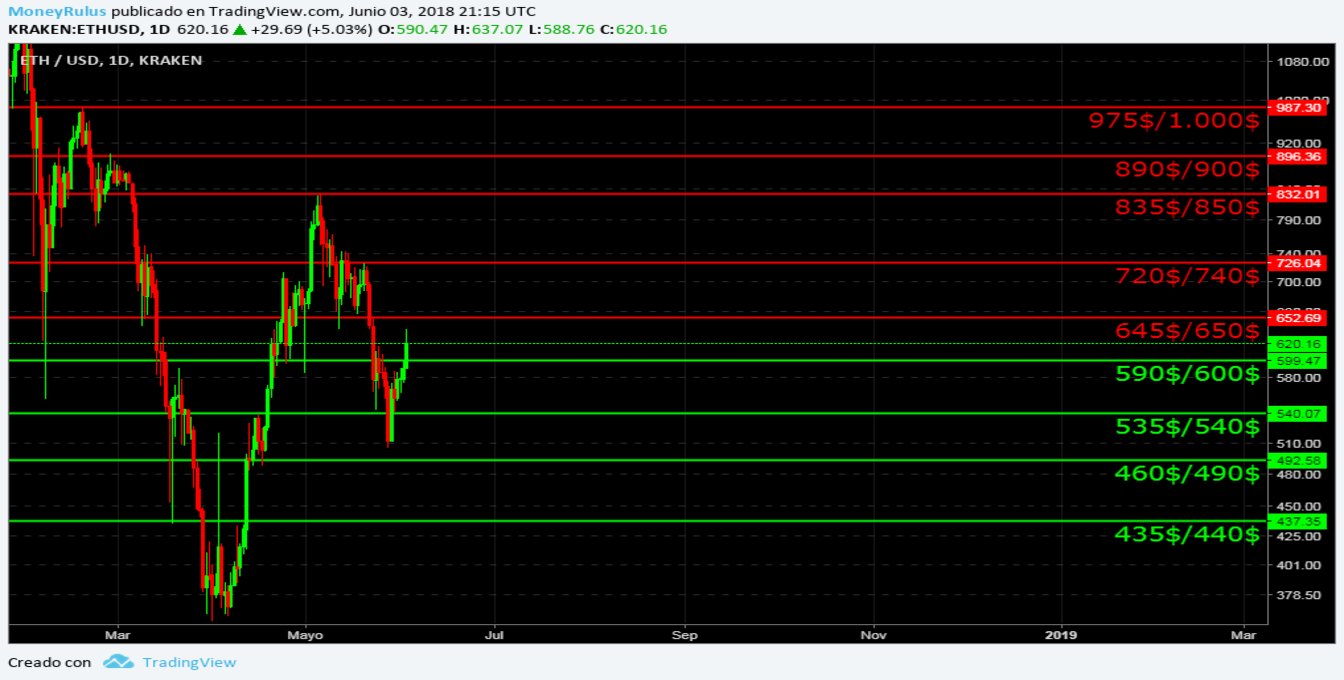
- In case of continuing with the rebound, the currency can find resistances in the $ 645 / $ 650, $ 720 / $ 740, $ 835 / $ 850, $ 890 / $ 900 and $ 975 / $ 1,000, all psychological levels. Since the resistance of $ 590 / $ 600 broke, it became a support.
- If ETH decides to lower the price, it can find nearby supports in the areas of $ 590 / $ 600, $ 535 / $ 540, $ 460 / $ 490 and $ 435 / $ 440.
Ripple, XRP / USD
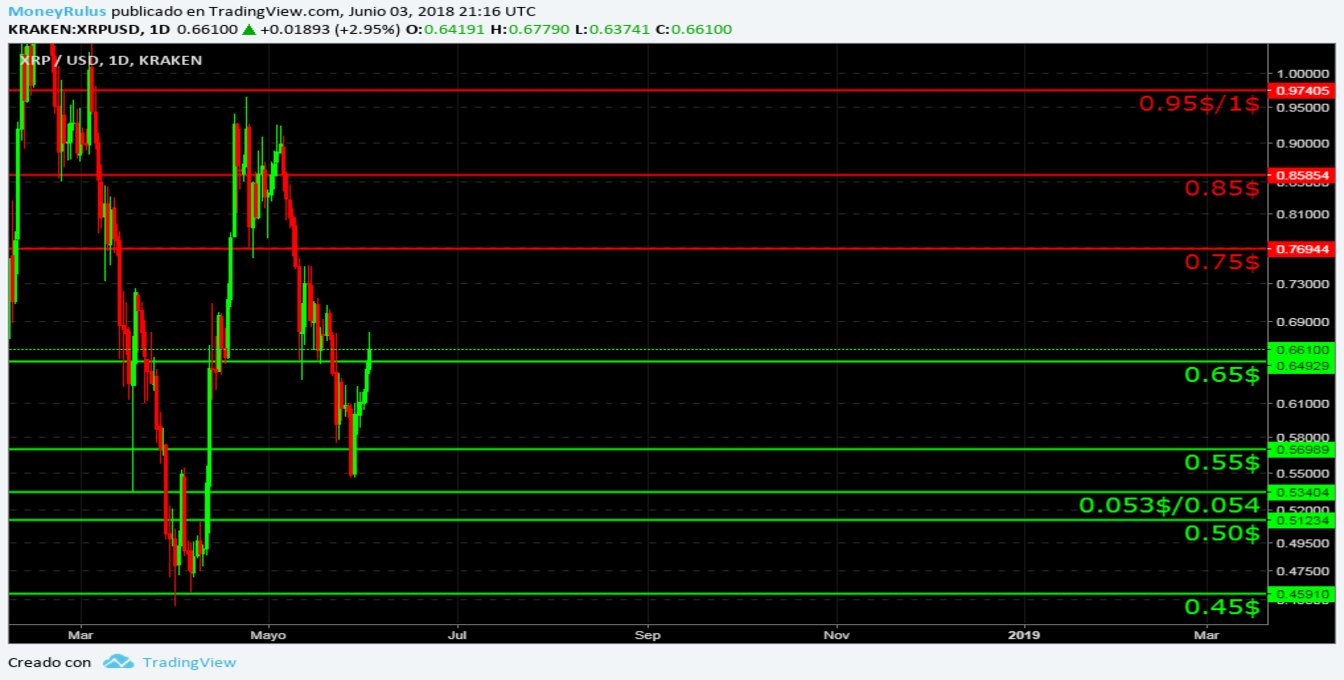
The pair XRP / USD in the Kraken exchange house, continues forming the symmetrical triangle (pattern of continuation) of great size of which we have been speaking about for weeks, the volume continues diminishing gradually with the advance of the pattern, that is to say supports (see pink line), this pattern, as already mentioned, indicates the possibility of continuation of the upward trend, so if it is broken upwards (with strength), the rising trend line (green line), could serve as support in the future (dotted green line).
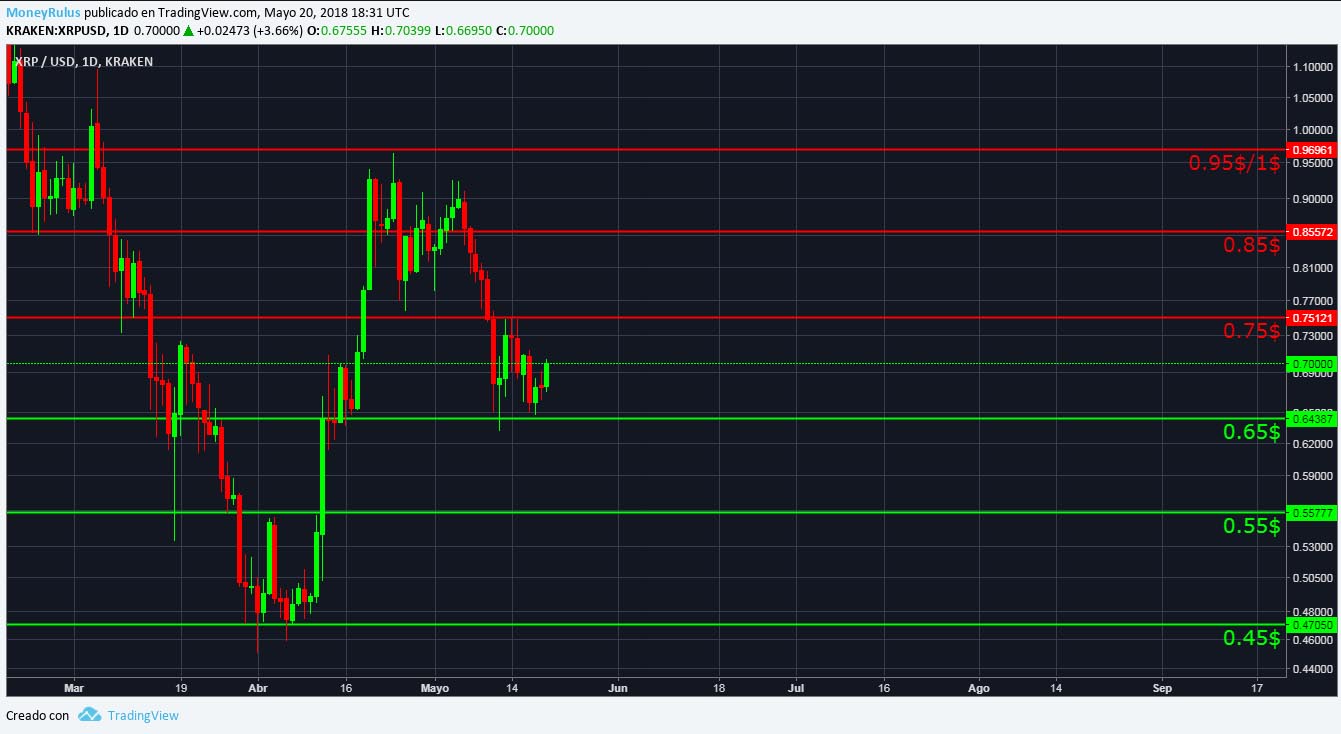
- In case of staying on its upward course, the currency may find resistance in areas of $ 0.75, $ 0.85 and $ 0.95 / $ 1. Resistance remains almost intact, apart from the area of $ 0.65 which became a support, after being broken.
- They may show some supports in areas of $ 0.65, $ 0.55, $ 0.53 / $ 0.54 and $ 0.45.
Bitcoin Cash, BCH / USD
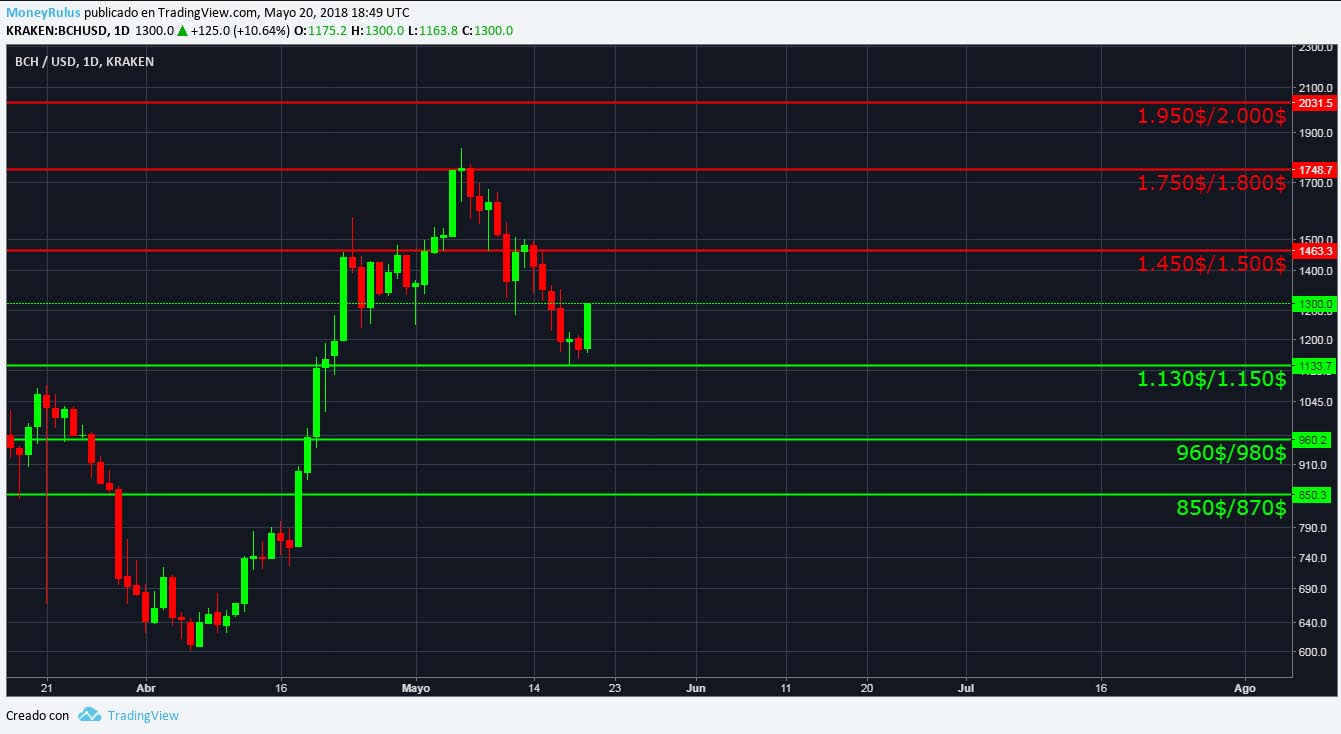
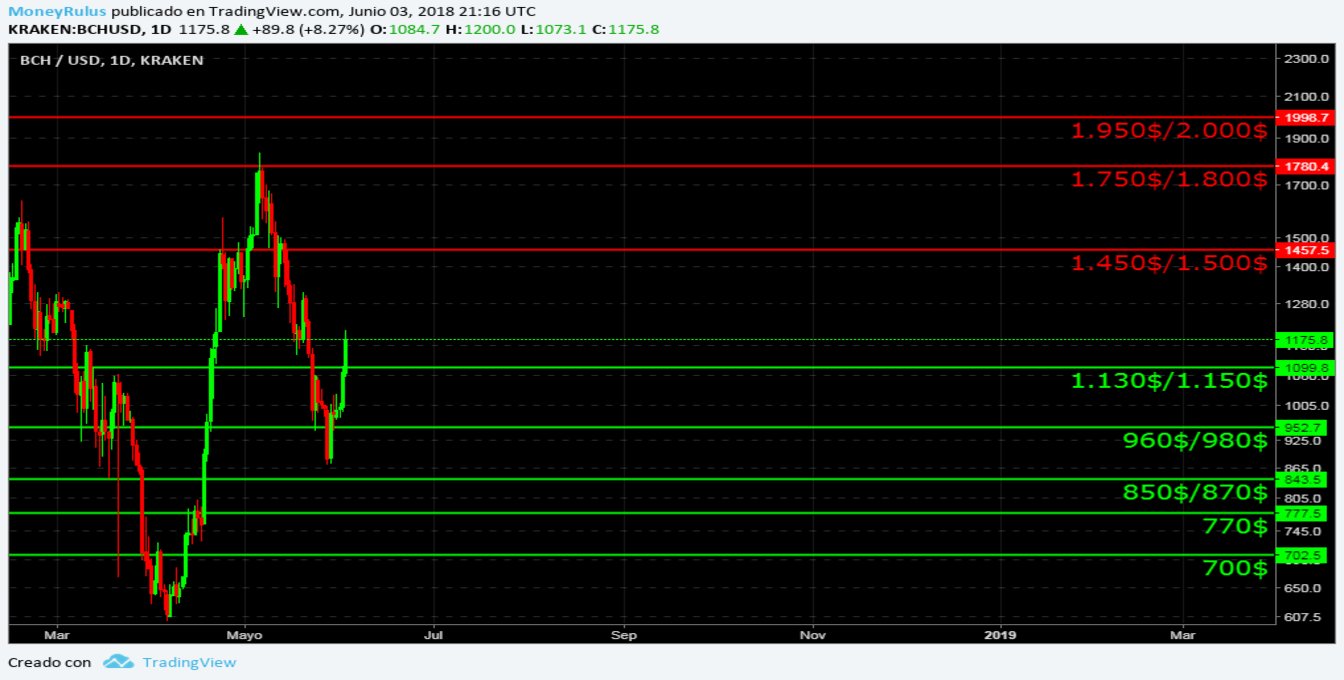
The pair BCH / USD in the Kraken exchange house, continues exemplifying the same symmetrical triangle similar to the one of the XRP / USD pair, as it is already known, it is a pattern of great size as we have verified, the volume has diminished gradually with its advance (see pink line), that is to say it affirms the pattern, this pattern as we are aware of the tendancies is very interesting. In addition to that, we must remember the fractal that is located to the left of it (previously this aspect has been briefly explained), as a reminder of the existing potential.
- In case of persevering upwards, BCH can find resistances in the areas of $ 1,450 / 1,500 $, $ 1,750 / $ 1,800 and $ 1,950 / $ 2,000 (psychological level that remain vital). The area resistance of 1,130 $ / 1,150 $ was broken, so it has become a support.
- If the pair takes a downward direction, supports can be reached in the areas of $ 1,130 / $ 1,150, $ 960 / $ 980, $ 850 / $ 870, $ 770 and $ 700 (a significant psychological level, with no room for hesitation) .
EOS, EOS / USD
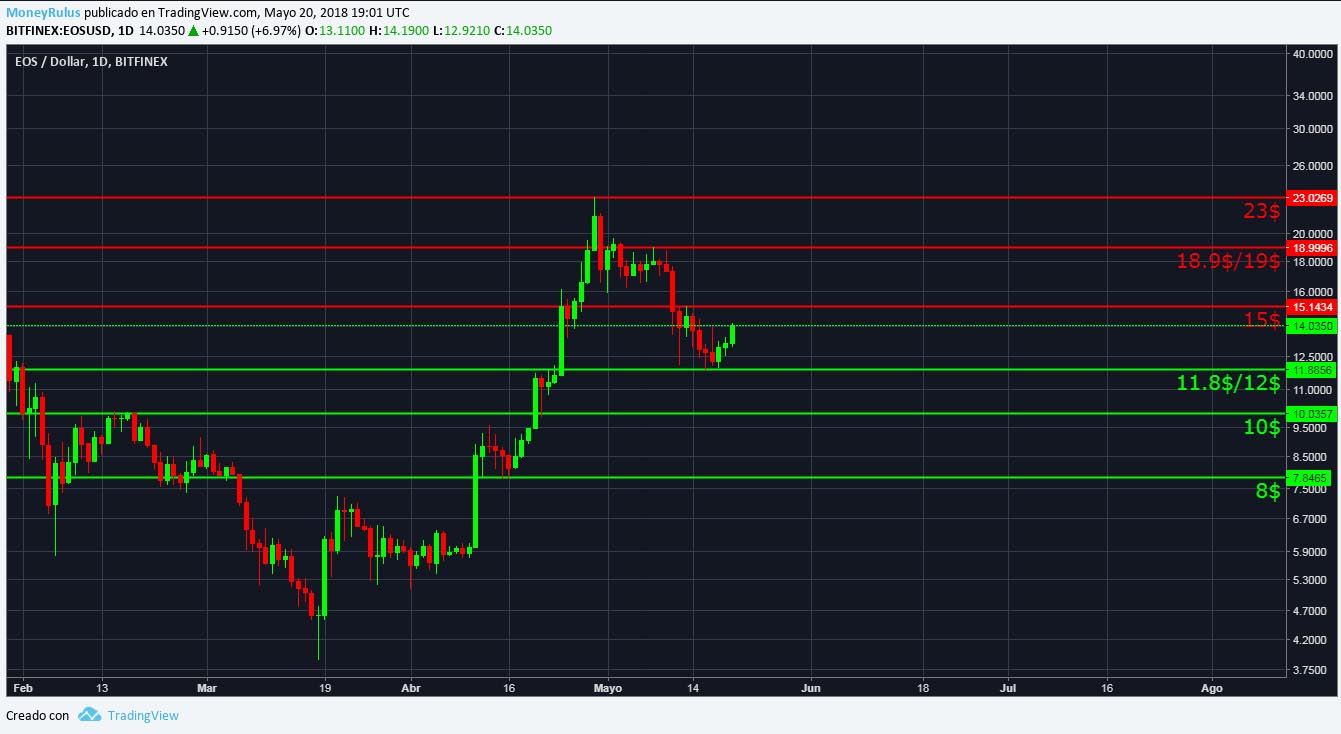
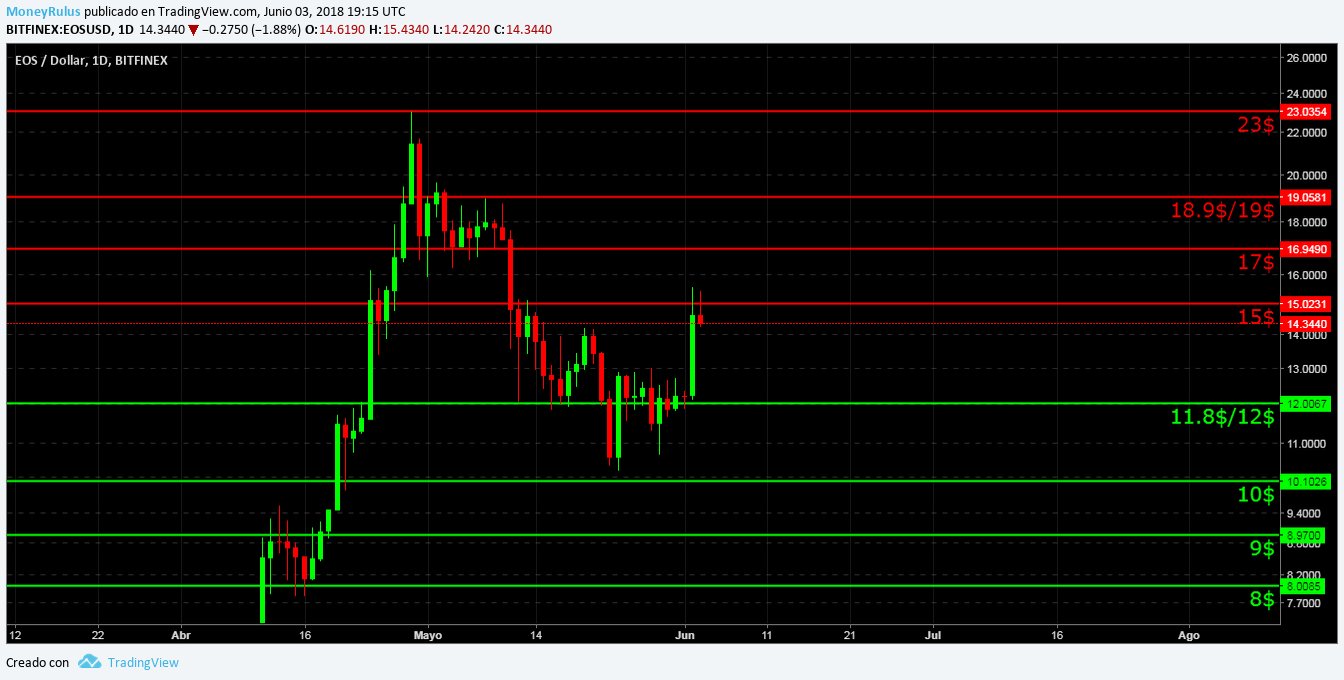
The pair EOS / USD in the BitFinex exchange house, stays on the line of upward tendency like this past week (green line) just after having rebounced in it, it continues showing the Cup & Handle pattern (bullish pattern) that we have already examined, so the trend still retains strength. The volume shows an excellent support (see pink lines), practically traced from the theory as we have seen in the past, which adds wisdom to the pattern, and the fact that it remains on the trend line after that rebound, it justifies itself more.
- Should it continue in the rebound, the pair can discover resistances in the areas of $ 15, $ 17, $ 18.9 / $ 19 and $ 23 (the historical maximum). Resistances remain intact since last week.
- At the same time, in the event that the descent continues, the areas of $ 11.8 / $ 12 (area from which it was recently pushed hard to approach the resistance of the $ 15), $ 10, $ 9 and $ 8 may serve as supports, important psychological levels.
Litecoin, LTC / USD
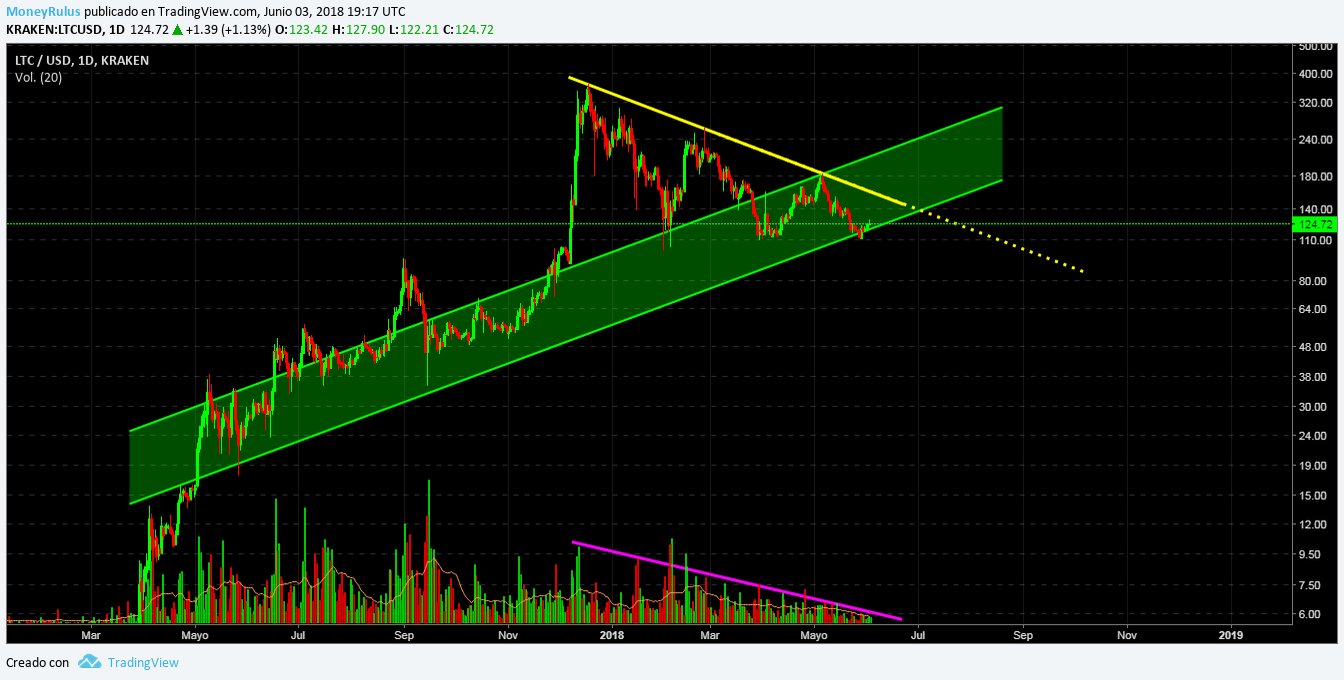
The LTC / USD pair at the Kraken exchange house shows a possible symmetrical triangle pattern that remains the same from the previous week, supported by volume (see pink line), which adds some confidence to the pattern. In addition, the price is at the moment in the ascending channel, and it seems that it bounced in the lower part of it, reason why it could be directed towards the high part of the channel.
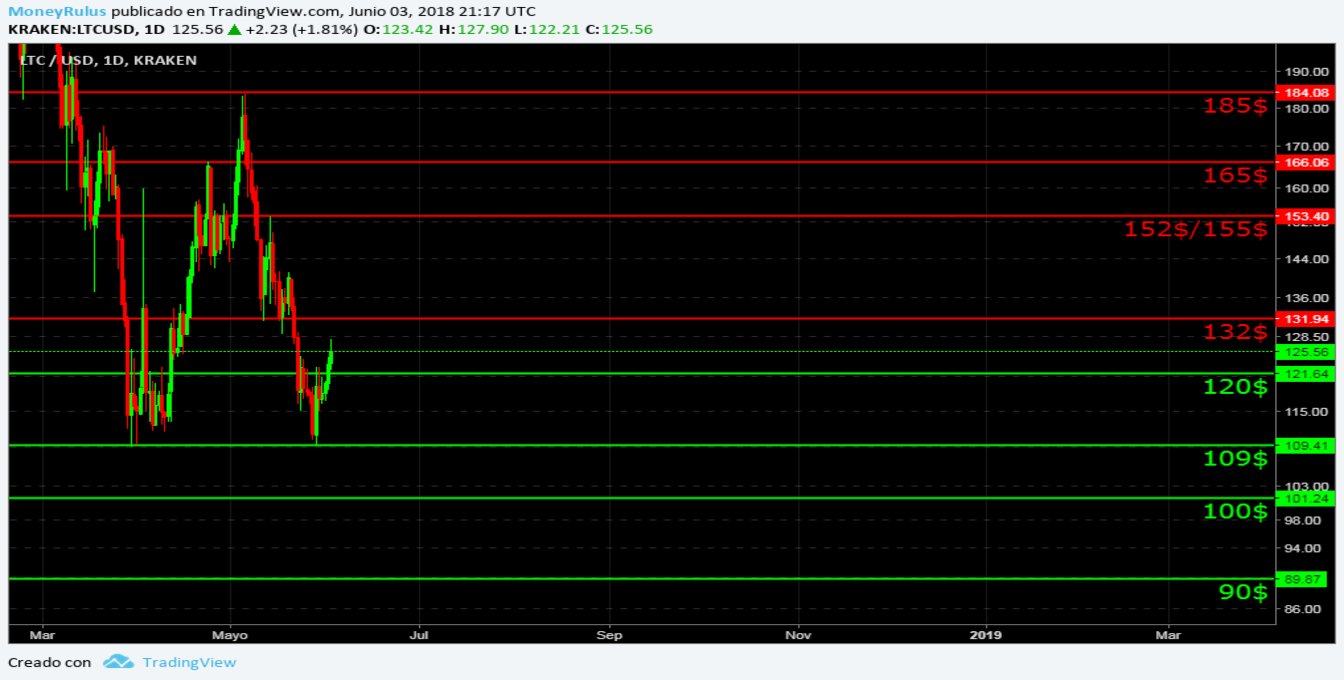
- If it persists in a downward movement in the medium term, it can present certain areas as supports, close to $ 120 (a resistance number until recently), $ 109, $ 100 and $ 90. Supports that are psychological levels of importance and validity.
- Resistance zones may be $ 132, $ 152 / $ 155, $ 165 and $ 185. Being transcendental zones. The area of $ 120 was broken, and stopped being a resistance to become a support.
Cardano, ADA / USD
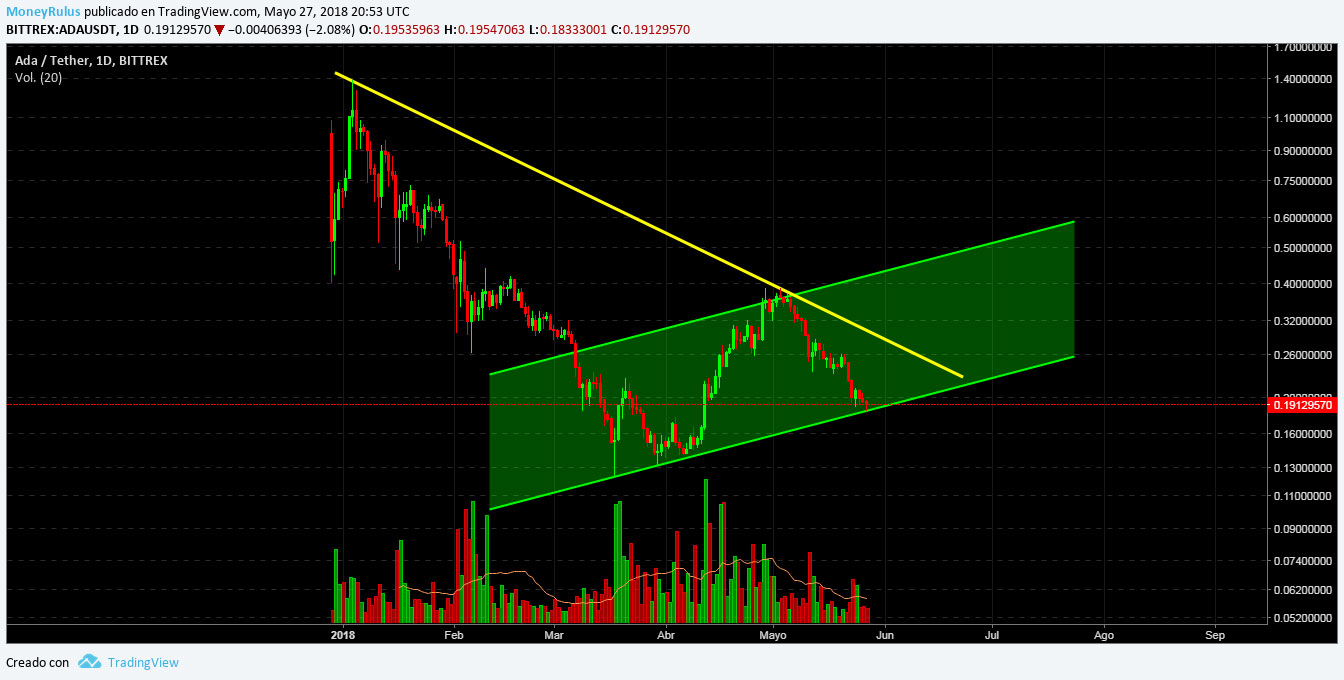
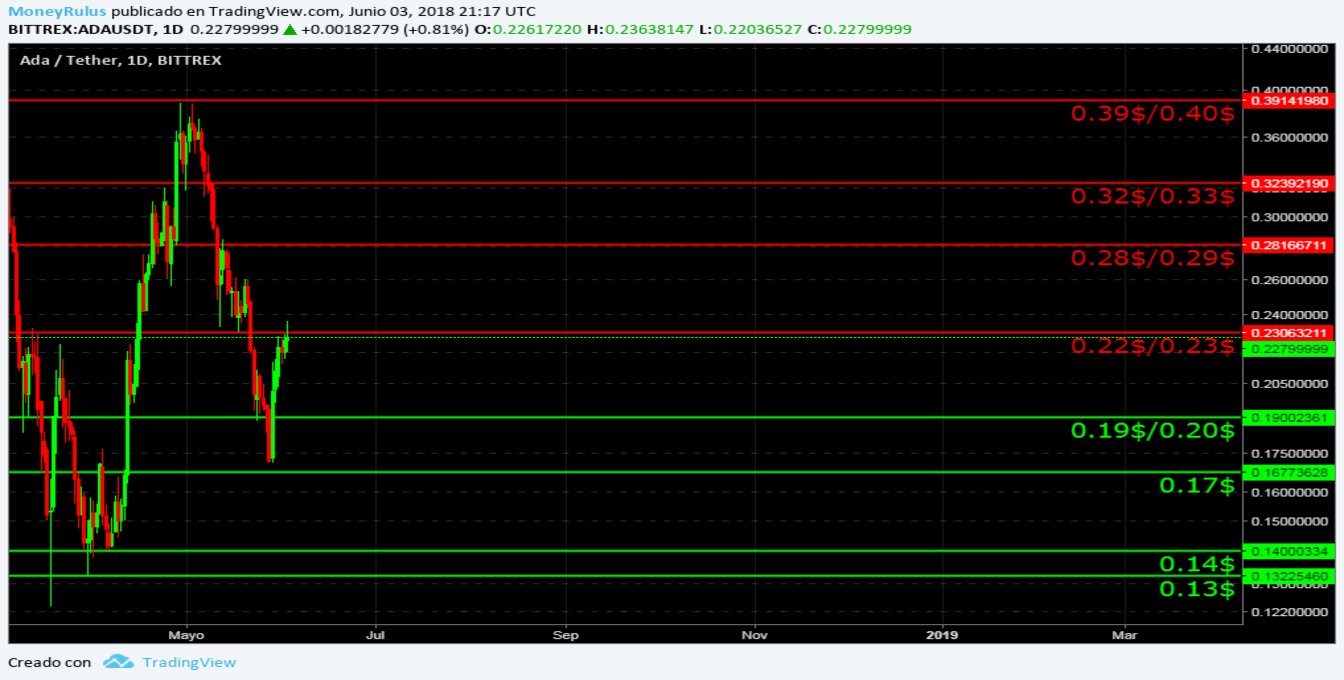
The ADA / USD pair in the Bittrex exchange house, shows the same ascending channel, which at this moment it appears to be near the bottom of the channel, after bouncing, so it can try to go to the top of it. The volume shows exhaustion, as in other currencies, so we can infer deterioration of the force.
- Resistances are exhibited in the areas of $ 0.22 / $ 0.23, $ 0.28 / $ 0.29, $ 0.32 / $ 0.33 and $ 0.39 / $ 0.40 , all resistances close to psychological levels and of an attractive importance, which for now remain intact.
- There are supports in the areas of $ 0.19 / $ 0.20 (psychological level), $ 0.17 (the area that provided a stable and strong livelihood), $ 0.14 and $ 0.13, these areas are vitally important, given the significant price bounce.
Stellar Lumens, XLM / USD
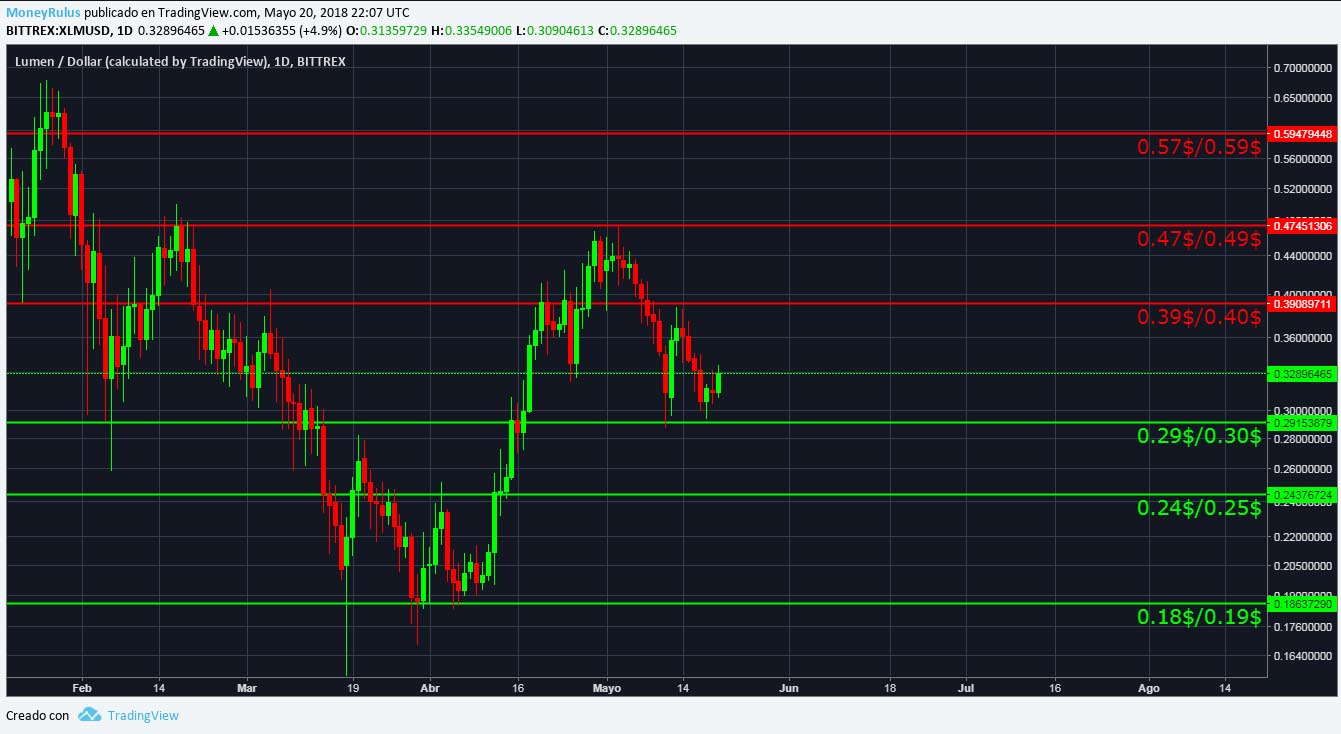
The pair XLM / USD in the Bittrex exchange house, shows the same ascendant in which the price is touching the lower part, reason why it could bounce and go towards the superior part of the channel. In addition to that, it follows the possible symmetric triangle pattern mentioned above, whose upper trend line (yellow line) acts as resistance, to reach the upper part of the channel, the price is forced to break and validate the triangular pattern. The volume affirms the pattern (pink line), although it should be noted that it is very little, almost invisible, which generates certain doubts about the force.
- In case of prolonging the upward trend, the currency can find resistances in the areas of $ 0.39 / $ 0.40, $ 0.47 / 0.49 $ and 0.57 $ / 0.59 $. The area of $ 0.29 / $ 0.30 was transferred, so it becomes a support.
- It is possible that supports are presented in the areas of $ 0.29 / $ 0.30 (the previous resistance), $ 0.24 / $ 0.25, $ 0.18 / $ 0.19, $ 0.17 and $ 0.15, interesting areas to consider.
IOTA, IOTA / USD
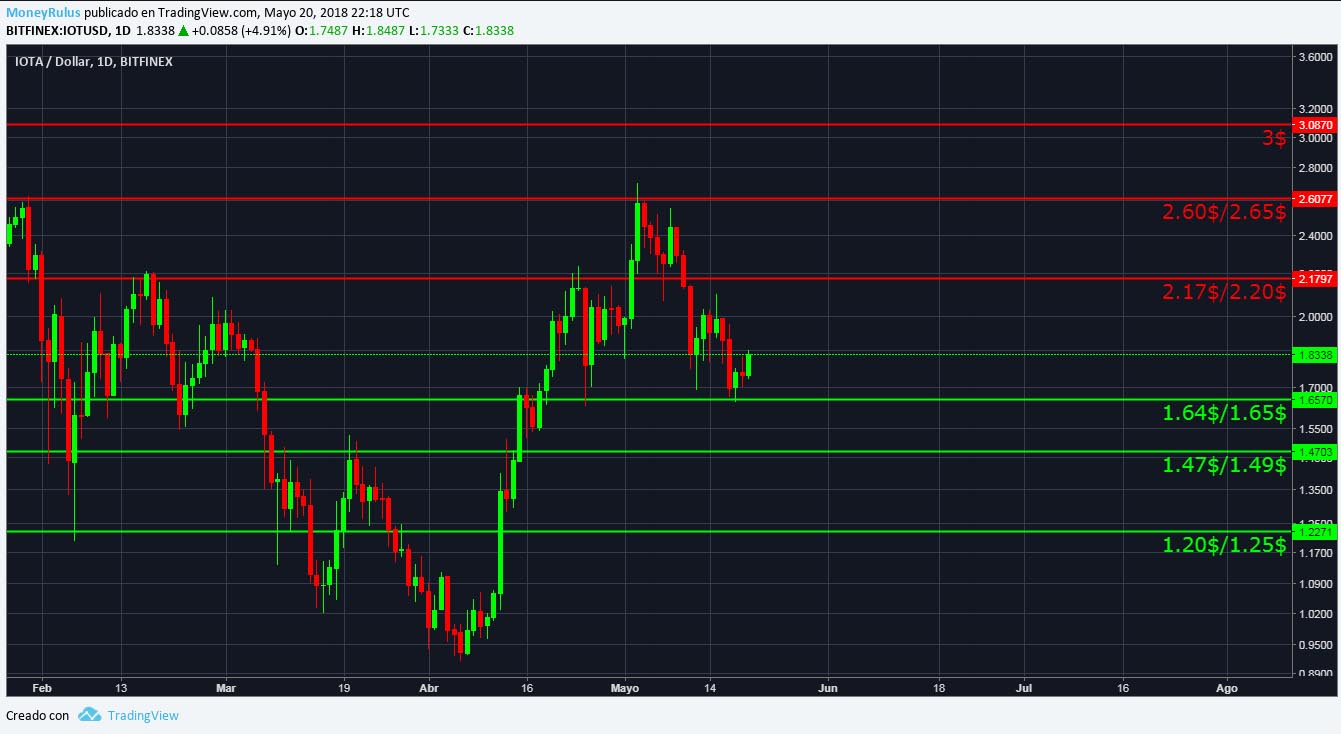
Let’s discuss the IOTA / USD pair in the BitFinex exchange house, which after having been displaced by TRX, recovered its place with force. The price shows the same ascending channel, after having bounced on the lower part of it, it seems to be heading towards the upper part of the channel. In addition to that, it shows the symmetrical triangle pattern, and right now is finding resistance in the orange trend line, the pattern is supported by the volume (pink line), acquiring some confirmation.
- If the market resolves continues rising, the price may discover resistances in the areas of $ 1.85, $ 2.17 / $ 2.20, $ 2.60 / $ 2.65 and $ 3. The areas of $ 1.47 / 1.49 $ and $ 1.64 / 1.65 $ were broken, so they will now become a support.
- Supports can be found in the areas of $ 1.47 / $ 1.49, $ 1.64 / $ 1.65, $ 1.20 / $ 1.25, $ 1.12 / $ 1.15, $ 1 and $ 0.9. Areas that acquire strength after the big rise in the price, or rather, after the bullish rally.
Tron, TRX / USD
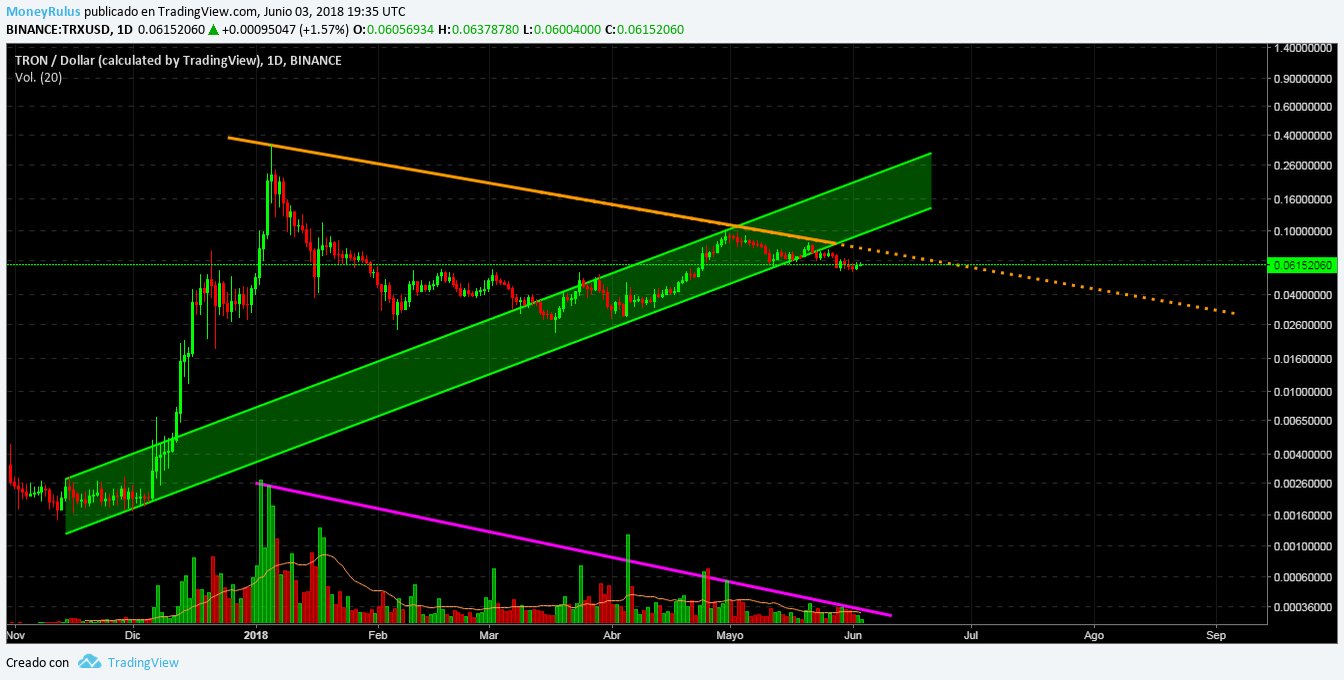
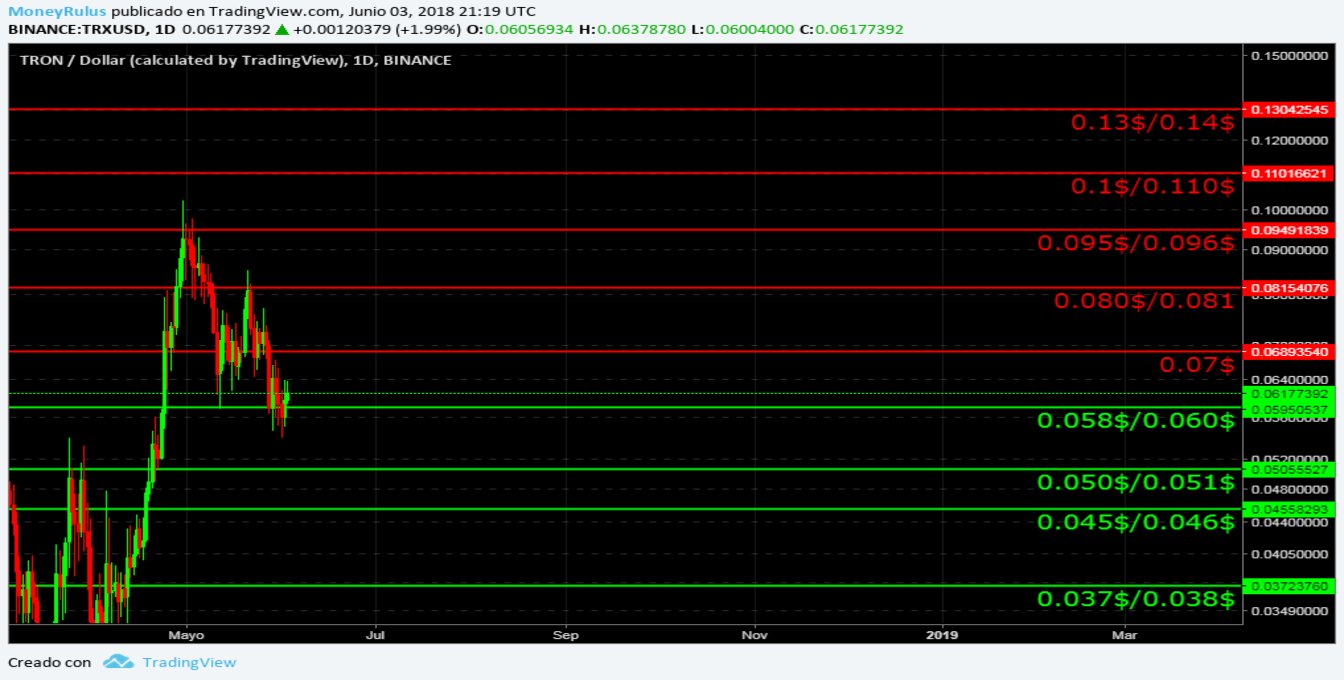
Finally, we see the TRX / USD pair in the Binance exchange house, at this moment it shows the same symmetrical triangle pattern, which has been broken down with very little force, and takes away the basis for the same break. The bearish trend line remains strong (orange color), so the price in case of not breaking can continue to fall. The ascending channel has been broken by the lower part, so we could expect the pull back for part of the price, to try to re-enter it again.
- In case TRX decides to overcome, it can find resistances in the areas of 0.07 $, $ 0.08 / 0081 $, 0095 $ / 0096 $, 0.1 $ / 0110 $ and $ 0.13 / 0.14 $, areas close to psychological levels that have been maintained intact since last week.
- In case of continuing the descent, the price can find supports in the areas of $ 0.058 / $ 0.060, $ 0.05 / $ 0.051, $ 0.045 / $ 0.046 and $ 0.037 / $ 0.038.. The area of $ 0.058 / $ 0.060 served as a support to stop the fall in price, something that is important to mention as this area acquires more strength from now on.


