After bullish hints mid this week, Bitcoin prices slumped on April 14, forcing the coin lower in a bear trend continuation pattern.
As per the formation in the daily chart, it is evident that sellers are clearly in control. The bounce of April 12 and 13 presented opportunities for aggressive traders to double down, aligning with the trend defining bar of April 11.
Technically, Bitcoin sellers are firmly in control in a bear breakout formation, dropping eight percent in the previous trading week.
Bitcoin can reach $100k Within the Next Year
On the news front, analysts are bullish on Bitcoin as the recent wave of institutional adoption hints at what could lie ahead.
Even though the coin seems to be struggling at spot rates, Bitcoin, according to the CEO of Nexo, Antoni Trenchev, could quickly soar to over $100k in the next year.
Nonetheless, in an interview with CNBC, the executive maintained a cautious stance on Bitcoin’s short-term performance. The U.S. Federal Reserve began tightening and ending its massive stimulus program.
Bitcoin Whales Aren’t Slowing Down
Meanwhile, MicroStrategy and Terra Foundation have been ramping up on Bitcoin, convinced that the coin, in the future, stands to be a reserve currency.
In the mid of a commodity crisis induced by the friction in Eastern Europe, Bitcoin and leading crypto assets have emerged as choice vehicles for moving value and preserving wealth.
It is this utility that Bitcoin proponent holds, complete with the network’s complete decentralization, will shore valuation, further propelling the network to prominence.
Bitcoin Technical Analysis
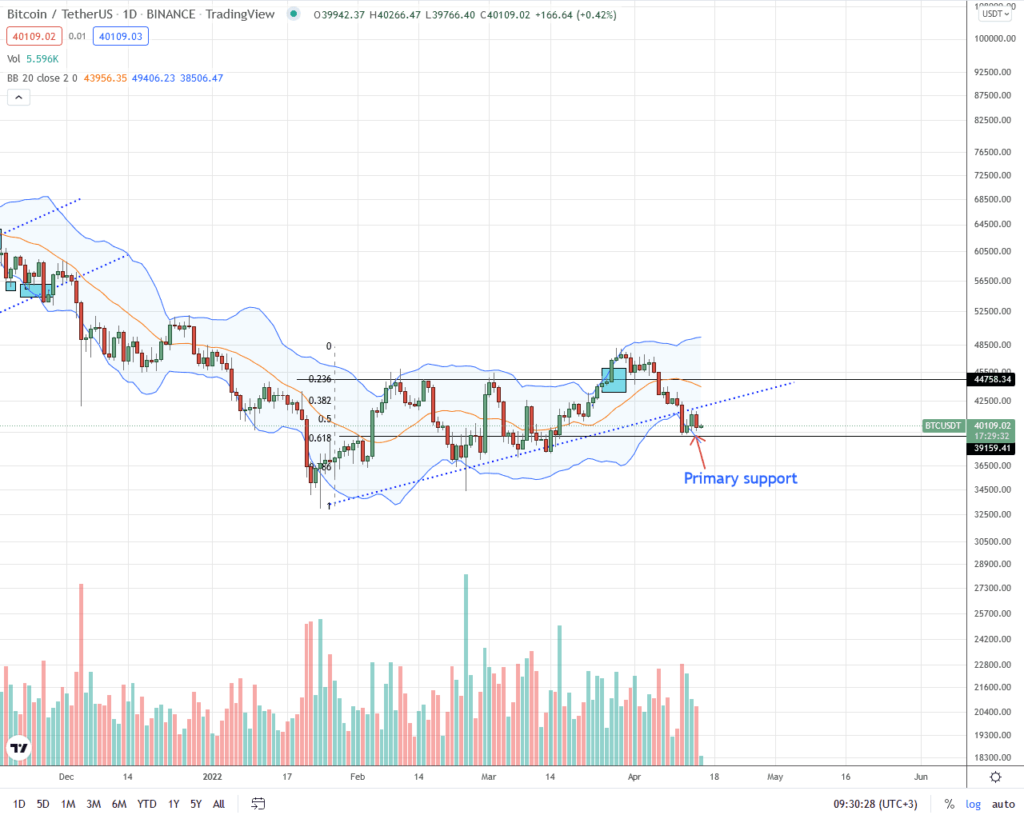
The Bitcoin price is down four percent on the previous day of trading. It hovers at around the 61.8 percent Fibonacci retracement level of the January 2022 lows and March 2022 highs, per the candlestick arrangement in the daily chart.
Overall, sellers are firmly in control. Notably, the bearish engulfing bar of April 14 wiped out the gains of April 13. As such, sellers are back in contention, continuing the trend set by the high volume and wide-ranging bear bar of April 11.
Based on the candlestick formation in the daily chart, aggressive traders can continue offloading the coin provided BTC is below $42.5k and April 11 high. The immediate target lies at $38k—flashing with March 2022 lows—and later Q1 2022 lows of around $34k.
An unexpected surge above $42.5k would draw buyers.
Technical charts courtesy of Trading View.
Disclaimer: Opinions expressed are not investment advice. Do your research.
If you found this article interesting, here you can find more Bitcoin news.