Bitcoin price performance has been a joy to watch for holders and traders. True, in the second half of 2019, prices collapsed from $13,800 to $6,500. There were worries of further slides but prices plateaued in December 2019 and this up-thrust is a reminder of early 2019 rally.
Recovering after a sour crypto winter, BTC prices rallied from lows of around $3,200, more than tripled, before topping at $13,800. It however more than halved to $6,500 in H2 2019 but now market participants are upbeat of future prices.
Stock to Flow Ratio Places BTC at astronomical Levels
Optimistic analysts place Bitcoin at over $200,000 in the next few years according to price forecasts from Stock to Flow Ratio. However, a standout in the last few years is the increasing utility of Bitcoin and how it has managed to attract investors. Firms have created impressive products around the coin.
The original Trololo Bitcoin price chart from Bitcointalk (2014). Just inserted the stock-to-flow (S2F) Bitcoin price (blue line) from Plan B (2019).
The main targets (10K, 100K) are almost the same. Pretty interesting.
Charts by Trololo and @100trillionUSD and @digitalikNet pic.twitter.com/y8kFgLfXtg
— Bit Harington (@bitharington) January 9, 2020
High Open Interest from Bitcoin Futures Platform is a net Positive
As such, Bitcoin has a deeper liquidity and investors can now comfortably bet on future prices.
From this, data from Skew reveals that there is more money flowing into Bitcoin as the number of open interests of Bitcoin futures is at $3.5 billion at the time of writing.
Global open Interest ticked up 15% to $3.5bln pic.twitter.com/4a4i9wlyY0
— skew (@skewdotcom) January 15, 2020
Open interest measures the number of aggregated positions of Bitcoin Futures that are open at snapshot time.
As the market gallops, this number could rise as more capital flows in, reducing volatility in the process.
BTC/USD Price Analysis
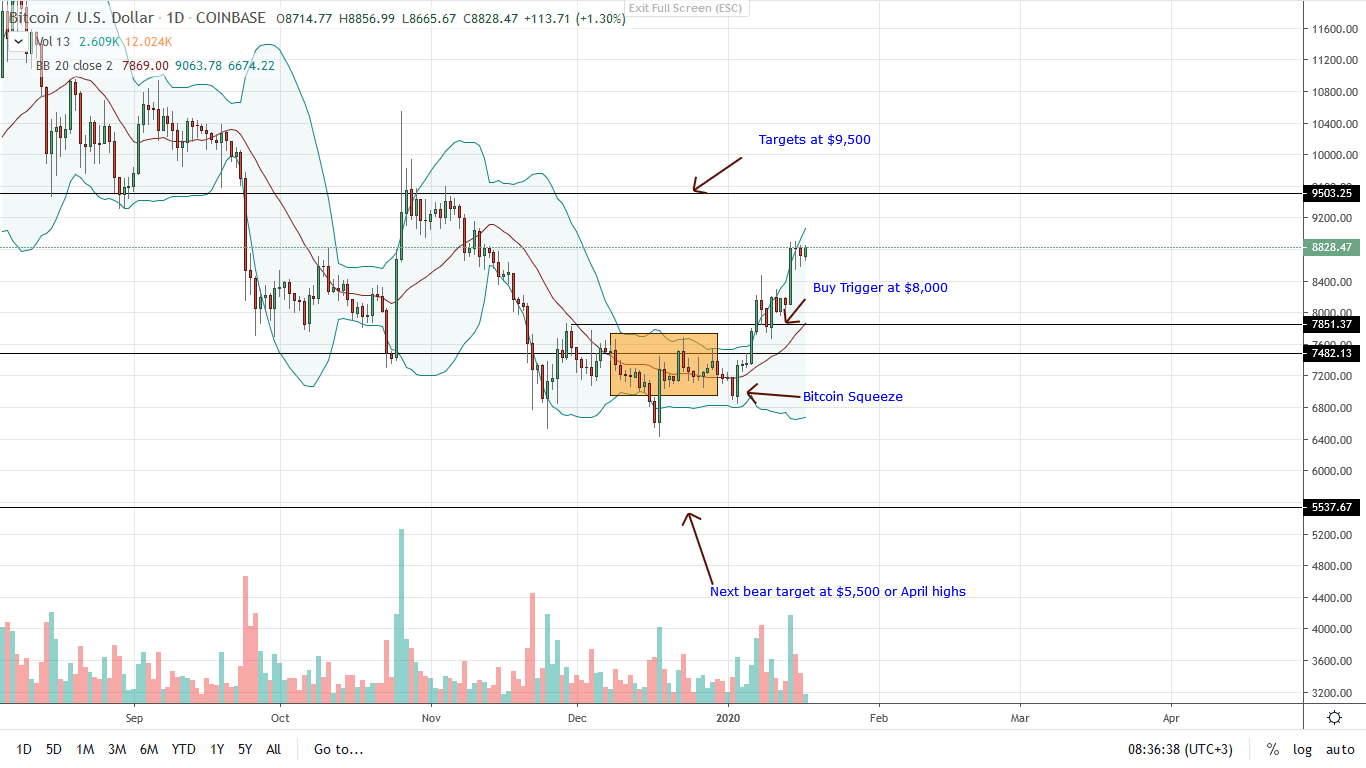
From BTC/USD price action, the ultimate target for hopeful bulls is within the $9,200-$9,600 resistance zone.
Presently, bulls have the upper hand and as prices shoot higher after erupting from the BB squeeze, day trades may take the opportunity to add to their longs on dips.
At press time, prices are steady and trending inside Jan 14 conspicuous bull bar. Although there is a level of over-valuation as Jan 15 bar closed above the upper BB, BTC stands to gain in the medium term simply because of candlestick arrangement.
Prices are notably oscillating inside Jan 14 bull bar, and from an effort versus result point of view, BTC could edge higher as buyers ramp up in lower time frames.
Any retracement back to the breakout level at around $7,800 to $8,000 may be an opportunity to buy the retest with practical target at $9,500.
Alternatively, traders can wait for a clean break above Jan 14 highs before loading up while targeting $9,500.
Chart courtesy of Trading View – Coinbase
Disclaimer: Views and opinions expressed are those of the author and is not investment advice. Trading of any form involves risk. Do your research.


