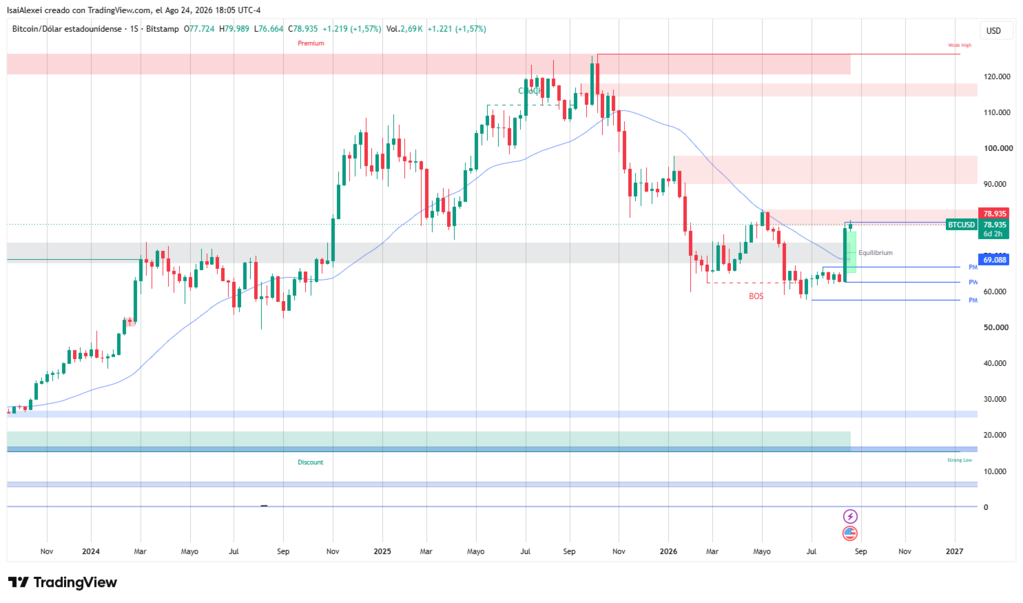
The 23% appreciation in Bitcoin’s value during the week of August 17–21, 2026, does not constitute an isolated event in the asset’s volatility history. The move, which carried the price from the $62,000–$67,000 range to above $77,000 in Friday’s session, presents a particularity that warrants analysis: the temporal synchronization with two fiscal policy events from the largest global economy.
On August 18, the US federal gross debt surpassed the $40 trillion threshold for the first time on record. The following day, the Treasury Department announced the doubling of the long-term bond buyback program, raising the per-operation cap from $2 billion to $4 billion. The coincidence of these two factors with the technical break above the 200-day moving average—a level not exceeded since November 2025—presents a scenario that transcends mere speculative narrative.
$40 trillion and the cost of debt service
The $40 trillion figure requires disaggregation for proper interpretation. Of this total, approximately $32.27 trillion corresponds to debt held by the public, while $7.78 trillion represents intra-governmental holdings. Federal debt stands at roughly 124% of US GDP, with Congressional Budget Office projections placing the fiscal year 2026 deficit at approximately $2.1 trillion, equivalent to 6% of GDP—above the 3% safety threshold.
The component generating greater concern among market participants is the cost of debt service. Net interest payments are projected above $1 trillion annually, exceeding Medicare spending and positioning as the second-largest federal budget item after Social Security. This figure implies that debt service consumes approximately one-fifth of federal revenues.
The structure of federal spending exacerbates the problem: roughly two-thirds of the budget corresponds to mandatory outlays—Social Security, Medicare, and debt interest—which limits fiscal adjustment options without incurring significant political costs. Even the complete elimination of non-defense discretionary programs would not balance the accounts.

The Treasury’s decision to double the long-term bond buybacks—applicable to securities with 10- to 30-year maturities—took effect with a schedule set for September 9, 2026. Treasury Secretary Scott Bessent indicated that the $4 billion per-operation cap could be exceeded, stating that “there is every indication that buybacks could exceed” that ceiling.
It is necessary to differentiate this operation from conventional quantitative easing. The Treasury is not creating new bank reserves nor expanding its balance sheet as the Federal Reserve would. The operation does not reduce total debt; it modifies the maturity profile, reducing long-term security holdings and increasing reliance on short-term issuance. The risk shifts toward the need for frequent refinancing.
The measure’s scope is limited in relative terms. Estimates place the annual program at approximately $128 billion, a figure representing only 2.3% of the estimated stock of long-term bonds outstanding (approximately $5.5 trillion). The intervention’s effect on rates was temporary: 30-year bond yields, which initially declined, rebounded 5.5 basis points to 5.249% in Thursday’s session.
The transmission mechanism to Bitcoin
The transmission of fiscal policy to Bitcoin’s price operates through three identifiable channels. The first is the interest rate channel. The reduction in long-term bond yields lowers the opportunity cost of holding yield-free assets such as Bitcoin and gold. The initial 9-basis-point decline in the 30-year bond yield following the Treasury announcement reduced the relative attractiveness of fixed-income assets.
The second channel is the liquidity effect on the financial system. Operators selling bonds to the Treasury receive cash that can be redeployed toward higher-risk assets, including cryptocurrencies. This flow has been reflected in ETF inflows.
The third channel is the most relevant from a structural perspective: the signal of accommodative policy emanating from the Treasury’s intervention. When a fiscal authority opts to buy its own long-term debt to depress rates, it signals its willingness to prioritize financing over fiscal adjustment. This interpretation is consistent with the concept of “fiscal dominance”: the situation in which monetary policy becomes subordinated to the government’s financing needs.
Institutional response and the role of ETFs
The institutional investor response to this context has manifested through flows into Bitcoin spot ETFs. During the rally week, the 13 US Bitcoin spot ETFs recorded net inflows of $1.9 billion, marking their best week since October 2025. In a single session—August 20—BlackRock’s iShares Bitcoin Trust (IBIT) attracted $606 million, representing 82% of total ETF inflows that day.
Bitcoin ETF trading volume increased from $6.9 billion to $22.1 billion over the course of the week. Ethereum ETFs also recorded inflows of $697.2 million, and digital asset products as a whole received $2.2 billion for the week.
This behavior differs from prior rallies that depended predominantly on short position covering. Liquidations of short positions in cryptocurrency derivatives totaled over $4 billion during the rally. However, the simultaneous presence of significant institutional flows suggests the existence of underlying demand that transcends the mere squeeze effect.
The 200-day moving average
From a technical analysis perspective, the break above the 200-day simple moving average constitutes a relevant event. Bitcoin had not traded above this level since November 2025. The 200-day moving average is used by market participants as an indicator of medium- and long-term trend.
Additionally, the 50- and 200-day moving averages are approaching a golden cross, according to Crypto Economy analysis. This cross, when confirmed, is interpreted by some traders as a signal of a structural momentum change.
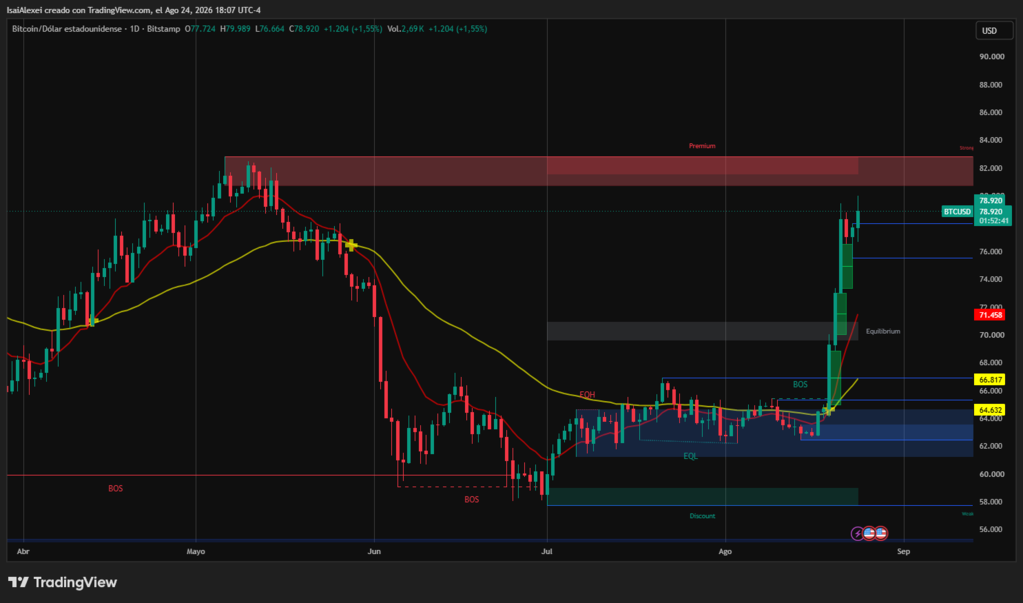
However, the interpretation of these indicators requires contextualization. Bitcoin’s price remains 37% below its all-time high of $126,198 reached in October 2025. The pre-rally trading range—$62,000 to $67,000—had persisted for several weeks, suggesting that the recent move represents a range break rather than a long-term trend reversal.
The Ray Dalio perspective and the debt cycle framework
Ray Dalio’s public intervention adds an analytical layer to the current context. In a LinkedIn post, Dalio warned that a debt crisis in the United States could materialize “in three years, give or take two.” His estimate is based on the difference between government revenues (approximately $5.5 trillion) and expenditures (approximately $7.5 trillion), leaving a $2 trillion deficit. Interest costs will reach $1 trillion this year, and approximately $10 trillion of debt must be refinanced.
Dalio recommended that investors reduce exposure to debt assets such as bonds, and allocate between 10% and 15% of their portfolios to gold, with a smaller position—described as “a little”—in Bitcoin. His recommendation is grounded in the framework of diversification and reducing dependence on assets tied to highly indebted governments.
Dalio noted that he expects “non-government-produced currencies like gold and Bitcoin to perform relatively well” as government debt continues to grow. He projects that federal debt could reach $55–60 trillion within a decade, assuming the current trajectory holds.

The rally has been accompanied by signals of regulatory support from the Trump administration. The president met with crypto industry executives at the White House and urged the Senate to advance the CLARITY Act, a market structure bill that had passed the House of Representatives in July 2025.
The legislative timeline places the cloture vote on the CLARITY Act for September 15, 2026. The probability of the bill’s passage in 2026, according to Polymarket data, stands at 16%, a significant reduction from the 82% recorded in February.
CFTC Chairman Mike Selig stated that he would use the agency’s existing authority to advance the administration’s crypto policy agenda. The interaction between these regulatory factors and the fiscal context configures an environment of multiple catalysts operating simultaneously.
The sustainability of the current rally faces structural obstacles. First, the temporary nature of the Treasury’s intervention: the buyback program has a defined schedule (September 9 to November 4), and its effect on rates has proven transitory. Second, the short squeeze component has been a significant factor in the magnitude of the move; once short positions are covered, the buying pressure derived from this mechanism diminishes.
The 30-year bond yield remains at historically elevated levels (5.249%), indicating that market participants have not fully discounted fiscal concerns. If rates continue their upward trend, the opportunity cost of holding Bitcoin would increase, exerting downward pressure on price.
ETF trading volume has shown significant acceleration, but the relevant question is whether these flows represent a structural portfolio reallocation or tactical short-term positioning.
The 23% rally in Bitcoin during the week of August 17, 2026, is linked to specific fiscal conditions of the US economy: federal debt crossing above $40 trillion and the Treasury’s intervention in the long-term bond market. The transmission of these events to Bitcoin’s price has occurred through identifiable mechanisms: reduced opportunity cost, increased liquidity, and accommodative policy signaling.
The institutional response—reflected in $1.9 billion in ETF inflows over one week—suggests that a segment of the market is interpreting these events as part of a broader structural trend. Dalio’s warning of a possible debt crisis within a three-year horizon adds weight to the thesis that the fiscal deterioration of developed economies could continue to drive demand for non-sovereign assets.