Bitcoin may be heading for another all-time high soon. There are some metrics showing an increased activity on the blockchain. When the activity on a blockchain rises, we can expect a rising demand that can result in more price jumps for the native token, BTC in here.
The latest analysis by Santiment suggests that a new all-time may happen for Bitcoin. Maybe the interesting $100k target is going to be touched this year.
According to a tweet from Santiment, the activity on the Bitcoin blockchain is increasing. It says:
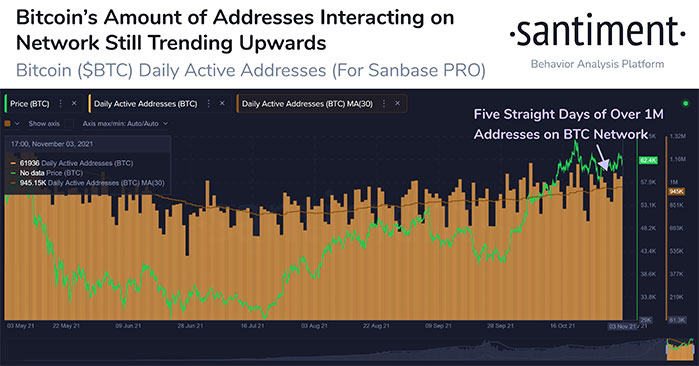
“#Bitcoin has had five straight days (excluding historically slow weekends) of over 1M active addresses interacting on the $BTC network. This rise is an encouraging sign that another #AllTimeHigh can inevitably be tested.”
As mentioned above, more addresses are actively using the blockchain. It means more coins are getting transferred in the Bitcoin blockchain. The historical data shows that when the number of active addresses increases, we can expect price rises for BTC.
The data in the latest analysis of Santiment point at BTC daily active addresses for Sanbase Pro. It shows five straight days with over 1M active addresses in the Bitcoin network. It’s been an ATH for this metric since May 2021.
What do daily active addresses mean for blockchains, especially Bitcoin? In this blockchain, not every holder uses the network for transacting coins generally. Many people just buy and hold the coin and do their transactions in other networks like Ethereum. So, when the metric rises, it means people are moving their coins. It can be into or out of exchanges, P2P transactions, or anything similar. Besides, when new addresses are added to the network, we can say new users are coming to the network. It means more demand for the coin and an increasing price after that.
The last ATH in the price chart of Bitcoin at $67k was an important milestone for this network. It attracted many new retail traders who wanted to join the movement and invest in cryptocurrencies, especially BTC. But it’s been some days that Bitcoin price decreased and disappointed some early investors. Anyhow, the data shows that still more people are using the network for their transactions.
As the analysis says, even if the prediction is correct, we can only expect an ATH test in the Bitcoin price chart. It means the price may go down again because some of the investors sell their BTC at ATH. In fact, many other metrics are needed for a continuous ATH recording on a chart. It can happen for Bitcoin, though. We may see some interesting targets like $100k even before the end of the year.
If you found this article interesting, here you can find more Bitcoin news


![This is a sign that Bitcoin [BTC] could be heading for another ATH](https://crypto-economy.com//wp-content/uploads/2021/11/btc-1024x576.jpg)


