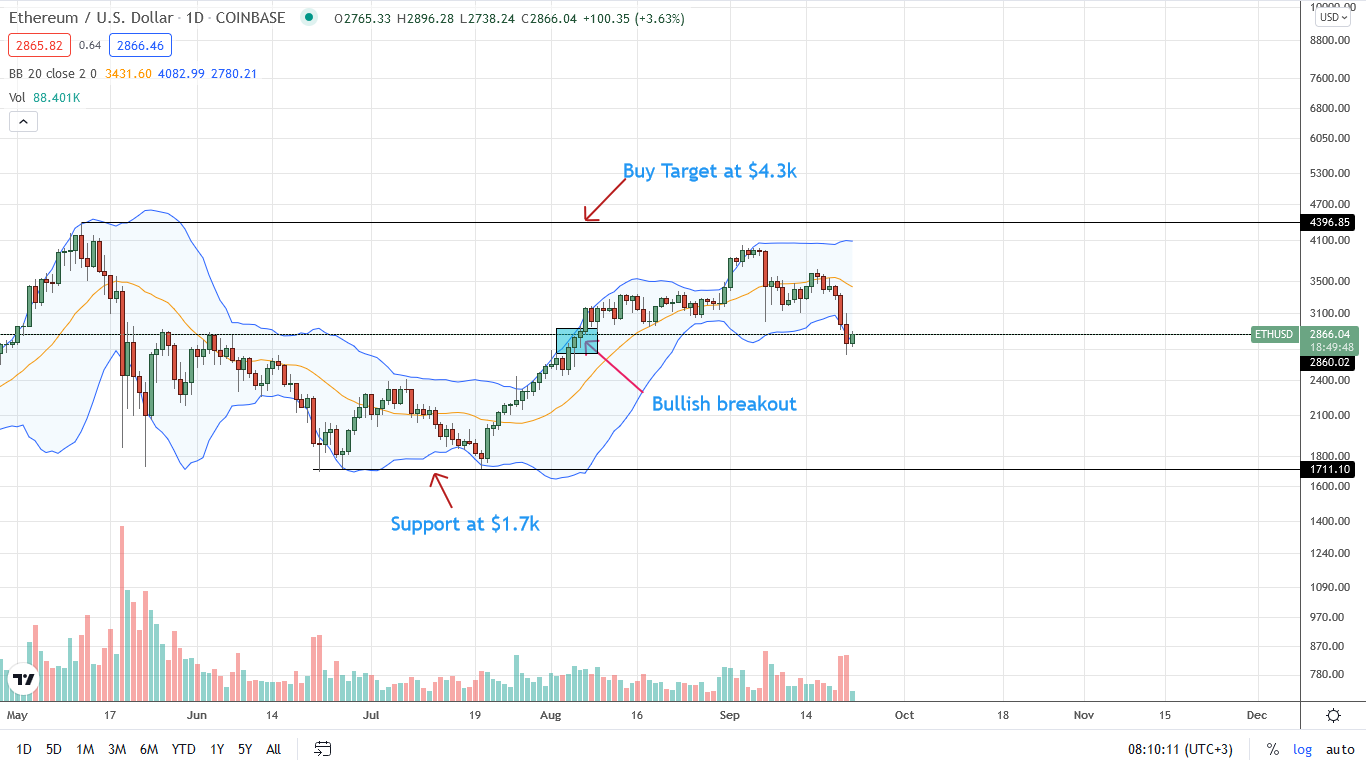
The Ethereum price is deep in red week-to-date, with scares of September 20 still reverberating across the crypto scene.
Although buyers are confident, the trend is set. There could be even more losses on the pipeline reading from price action in the daily chart.
Ethereum Head-and-Shoulder Pattern
From development in the daily chart, Peter Brandt has picked out a head-and-should pattern.
#Bear_Trap I have a strong suspicion that recent weakness, especially overnight, successfully washed out weak longs and might have trapped some bears. Of course subsequent price action would need to confirm this. $ETH pic.twitter.com/3begBYtHcu
— Peter Brandt (@PeterLBrandt) September 21, 2021
He is now warning users of possible extended losses set in motion by the September 20 bear bar, which mirrors September 7’s.
Usually, this candlestick arrangement is bearish and interpreted by chartists to mean peaks.
In this case, the analyst is pointing weakness and odds of ETH dropping below the $2.8k psychological mark.
The Rise of Layer-2s
Fundamentally, there is a positive development as far as the migration to layer-2 and improvement of Ethereum mainnet throughput is concerned.
According to statistics, cumulative Layer-2 TVL is rapidly expanding, rising 10X from early July 2021.
Meanwhile, evidence shows the gap between Layer-2s and Polygon being narrowed despite the latter running for longer than any Layer-2 solution.
Notably, Arbitrum remains the most active, locking over $2 billion of digital assets, acting as a universal Layer-2 scaling option open for all projects.
Exchanges and all intensive dApps on Layer-2 can launch from Arbitrum, saving users from Gas costs and slower layer-2 settlement times. Optimism is set for activation and would likely find adoption by one of Ethereum’s leading DEX, Uniswap.
Ethereum Price Analysis
Sellers are doubling down following September 21 losses.
With a well-defined bear bar closing below the $3k mark, sellers are comfortably in the driving seat.
Ethereum prices are trending in a bear breakout pattern mirroring September 7 and 20 bear bars, below the middle BB.
Aggressive traders might find unloading opportunities with every pullback towards $3k with immediate targets at $2.3k in the short-term.
If ETH bulls flow back, rewinding losses of September 20, the coin might pump higher towards $3.5k and later $4.4k in continuation of the August 2021 trend.
Technical charts courtesy of Trading View
Disclaimer: Opinions expressed are not investment advice. Do your research.
If you found this article interesting, here you can find more Ethereum News


